Immigrants from Egypt vs Immigrants from Netherlands Householder Income Ages 25 - 44 years
COMPARE
Immigrants from Egypt
Immigrants from Netherlands
Householder Income Ages 25 - 44 years
Householder Income Ages 25 - 44 years Comparison
Immigrants from Egypt
Immigrants from Netherlands
$103,192
HOUSEHOLDER INCOME AGES 25 - 44 YEARS
99.2/ 100
METRIC RATING
80th/ 347
METRIC RANK
$105,082
HOUSEHOLDER INCOME AGES 25 - 44 YEARS
99.7/ 100
METRIC RATING
65th/ 347
METRIC RANK
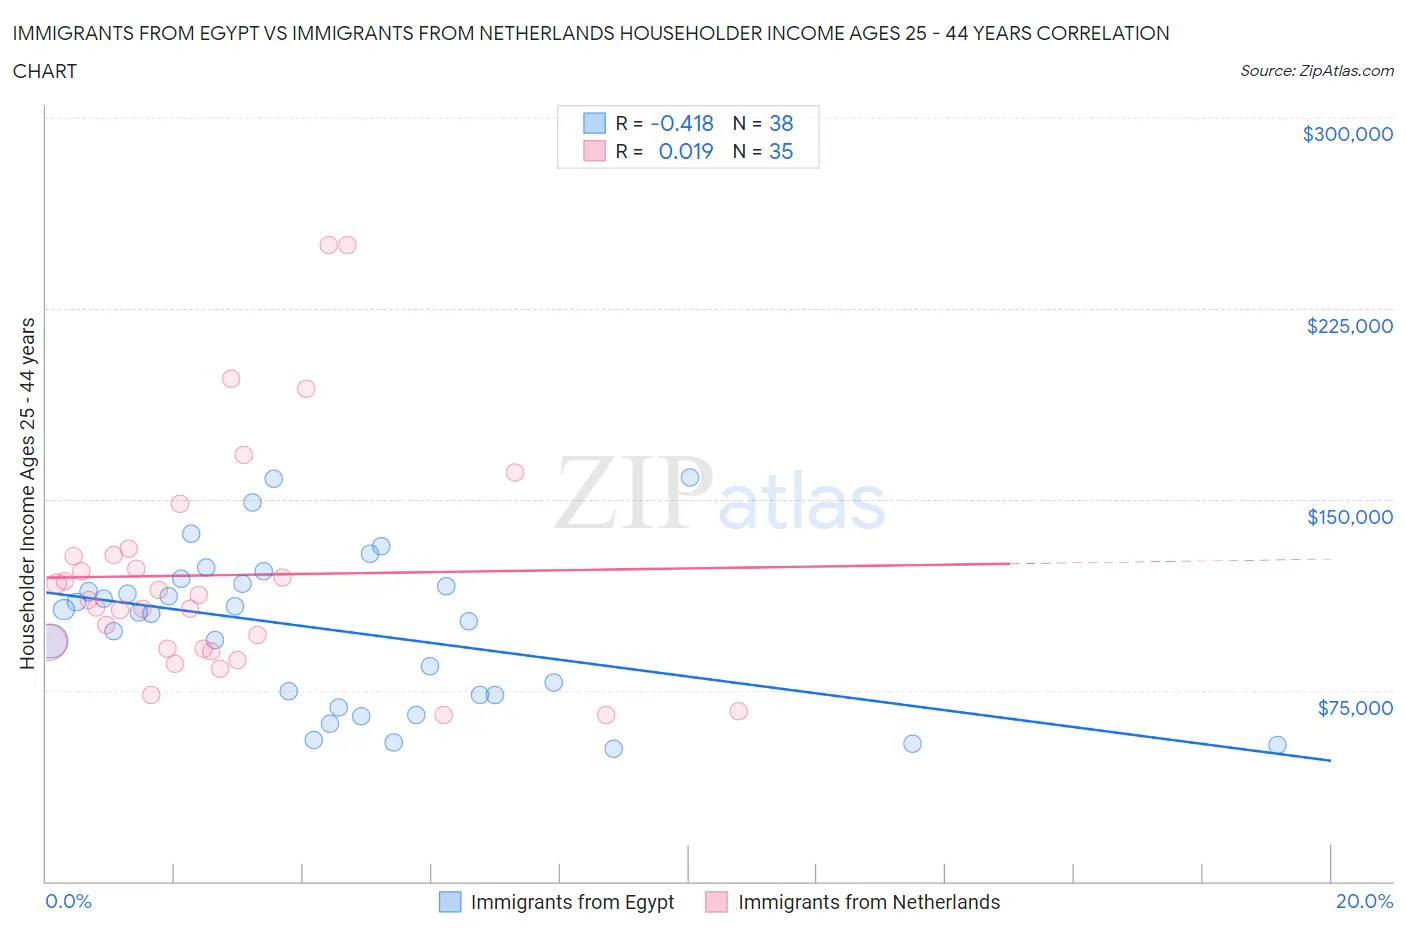
Immigrants from Egypt vs Immigrants from Netherlands Householder Income Ages 25 - 44 years Correlation Chart
The statistical analysis conducted on geographies consisting of 245,137,860 people shows a moderate negative correlation between the proportion of Immigrants from Egypt and household income with householder between the ages 25 and 44 in the United States with a correlation coefficient (R) of -0.418 and weighted average of $103,192. Similarly, the statistical analysis conducted on geographies consisting of 237,314,121 people shows no correlation between the proportion of Immigrants from Netherlands and household income with householder between the ages 25 and 44 in the United States with a correlation coefficient (R) of 0.019 and weighted average of $105,082, a difference of 1.8%.
Householder Income Ages 25 - 44 years Correlation Summary
| Measurement | Immigrants from Egypt | Immigrants from Netherlands |
| Minimum | $52,083 | $65,500 |
| Maximum | $158,487 | $250,001 |
| Range | $106,404 | $184,501 |
| Mean | $98,589 | $120,241 |
| Median | $105,246 | $110,291 |
| Interquartile 25% (IQ1) | $73,125 | $91,522 |
| Interquartile 75% (IQ3) | $116,638 | $128,108 |
| Interquartile Range (IQR) | $43,513 | $36,587 |
| Standard Deviation (Sample) | $30,067 | $45,284 |
| Standard Deviation (Population) | $29,669 | $44,632 |
Demographics Similar to Immigrants from Egypt and Immigrants from Netherlands by Householder Income Ages 25 - 44 years
In terms of householder income ages 25 - 44 years, the demographic groups most similar to Immigrants from Egypt are South African ($103,160, a difference of 0.030%), Immigrants from Serbia ($103,155, a difference of 0.040%), Armenian ($103,248, a difference of 0.050%), Immigrants from Bulgaria ($103,423, a difference of 0.22%), and Immigrants from Southern Europe ($103,486, a difference of 0.28%). Similarly, the demographic groups most similar to Immigrants from Netherlands are New Zealander ($105,085, a difference of 0.0%), Immigrants from Scotland ($105,089, a difference of 0.010%), Laotian ($104,993, a difference of 0.080%), Immigrants from Italy ($105,201, a difference of 0.11%), and Immigrants from Romania ($104,713, a difference of 0.35%).
| Demographics | Rating | Rank | Householder Income Ages 25 - 44 years |
| Immigrants | Italy | 99.7 /100 | #62 | Exceptional $105,201 |
| Immigrants | Scotland | 99.7 /100 | #63 | Exceptional $105,089 |
| New Zealanders | 99.7 /100 | #64 | Exceptional $105,085 |
| Immigrants | Netherlands | 99.7 /100 | #65 | Exceptional $105,082 |
| Laotians | 99.7 /100 | #66 | Exceptional $104,993 |
| Immigrants | Romania | 99.6 /100 | #67 | Exceptional $104,713 |
| Immigrants | Eastern Europe | 99.6 /100 | #68 | Exceptional $104,662 |
| Mongolians | 99.6 /100 | #69 | Exceptional $104,578 |
| Immigrants | Croatia | 99.6 /100 | #70 | Exceptional $104,503 |
| Afghans | 99.6 /100 | #71 | Exceptional $104,410 |
| Chinese | 99.5 /100 | #72 | Exceptional $104,264 |
| Italians | 99.5 /100 | #73 | Exceptional $104,215 |
| Immigrants | Fiji | 99.5 /100 | #74 | Exceptional $103,954 |
| Koreans | 99.4 /100 | #75 | Exceptional $103,824 |
| Immigrants | Spain | 99.4 /100 | #76 | Exceptional $103,752 |
| Immigrants | Southern Europe | 99.3 /100 | #77 | Exceptional $103,486 |
| Immigrants | Bulgaria | 99.3 /100 | #78 | Exceptional $103,423 |
| Armenians | 99.2 /100 | #79 | Exceptional $103,248 |
| Immigrants | Egypt | 99.2 /100 | #80 | Exceptional $103,192 |
| South Africans | 99.2 /100 | #81 | Exceptional $103,160 |
| Immigrants | Serbia | 99.2 /100 | #82 | Exceptional $103,155 |