Immigrants from Ecuador vs Immigrants from Eastern Europe Median Household Income
COMPARE
Immigrants from Ecuador
Immigrants from Eastern Europe
Median Household Income
Median Household Income Comparison
Immigrants from Ecuador
Immigrants from Eastern Europe
$80,341
MEDIAN HOUSEHOLD INCOME
4.5/ 100
METRIC RATING
234th/ 347
METRIC RANK
$93,051
MEDIAN HOUSEHOLD INCOME
99.4/ 100
METRIC RATING
81st/ 347
METRIC RANK
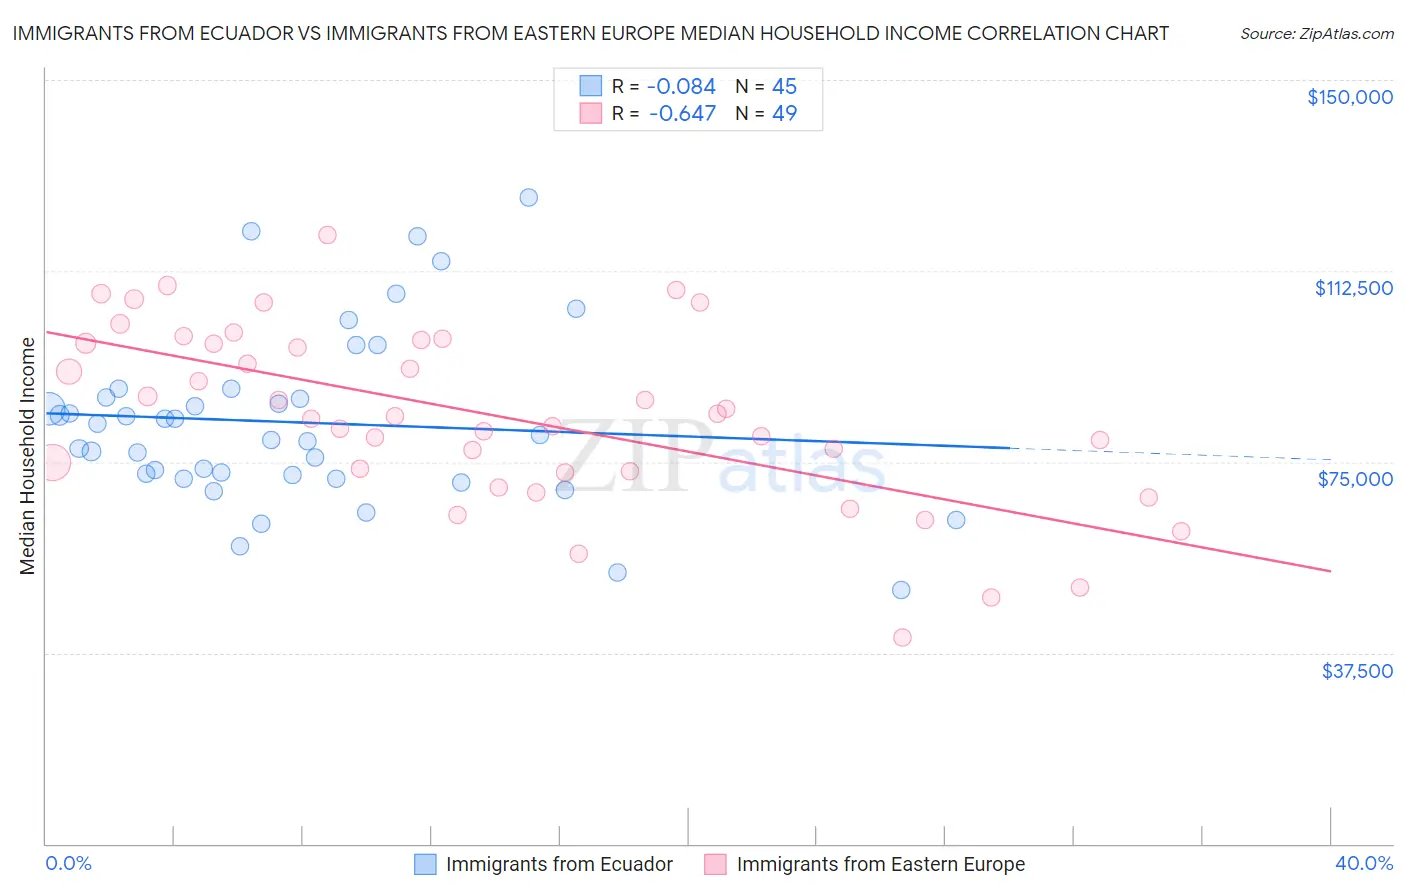
Immigrants from Ecuador vs Immigrants from Eastern Europe Median Household Income Correlation Chart
The statistical analysis conducted on geographies consisting of 270,856,843 people shows a slight negative correlation between the proportion of Immigrants from Ecuador and median household income in the United States with a correlation coefficient (R) of -0.084 and weighted average of $80,341. Similarly, the statistical analysis conducted on geographies consisting of 475,370,046 people shows a significant negative correlation between the proportion of Immigrants from Eastern Europe and median household income in the United States with a correlation coefficient (R) of -0.647 and weighted average of $93,051, a difference of 15.8%.
Median Household Income Correlation Summary
| Measurement | Immigrants from Ecuador | Immigrants from Eastern Europe |
| Minimum | $49,886 | $40,467 |
| Maximum | $126,873 | $119,517 |
| Range | $76,987 | $79,050 |
| Mean | $82,745 | $84,121 |
| Median | $80,365 | $83,863 |
| Interquartile 25% (IQ1) | $72,009 | $72,994 |
| Interquartile 75% (IQ3) | $88,454 | $98,652 |
| Interquartile Range (IQR) | $16,444 | $25,658 |
| Standard Deviation (Sample) | $17,127 | $17,573 |
| Standard Deviation (Population) | $16,935 | $17,393 |
Similar Demographics by Median Household Income
Demographics Similar to Immigrants from Ecuador by Median Household Income
In terms of median household income, the demographic groups most similar to Immigrants from Ecuador are Immigrants from the Azores ($80,357, a difference of 0.020%), Immigrants from Guyana ($80,324, a difference of 0.020%), Immigrants from Trinidad and Tobago ($80,373, a difference of 0.040%), Bermudan ($80,406, a difference of 0.080%), and Trinidadian and Tobagonian ($80,402, a difference of 0.080%).
| Demographics | Rating | Rank | Median Household Income |
| Guyanese | 5.7 /100 | #227 | Tragic $80,734 |
| Immigrants | Bangladesh | 5.7 /100 | #228 | Tragic $80,722 |
| Delaware | 5.0 /100 | #229 | Tragic $80,527 |
| Bermudans | 4.7 /100 | #230 | Tragic $80,406 |
| Trinidadians and Tobagonians | 4.7 /100 | #231 | Tragic $80,402 |
| Immigrants | Trinidad and Tobago | 4.6 /100 | #232 | Tragic $80,373 |
| Immigrants | Azores | 4.5 /100 | #233 | Tragic $80,357 |
| Immigrants | Ecuador | 4.5 /100 | #234 | Tragic $80,341 |
| Immigrants | Guyana | 4.5 /100 | #235 | Tragic $80,324 |
| Immigrants | Bosnia and Herzegovina | 3.4 /100 | #236 | Tragic $79,888 |
| Nicaraguans | 3.1 /100 | #237 | Tragic $79,737 |
| Barbadians | 3.0 /100 | #238 | Tragic $79,664 |
| Alaska Natives | 2.7 /100 | #239 | Tragic $79,509 |
| Immigrants | Western Africa | 2.7 /100 | #240 | Tragic $79,490 |
| Immigrants | Nonimmigrants | 2.6 /100 | #241 | Tragic $79,429 |
Demographics Similar to Immigrants from Eastern Europe by Median Household Income
In terms of median household income, the demographic groups most similar to Immigrants from Eastern Europe are Tongan ($93,076, a difference of 0.030%), Sri Lankan ($93,093, a difference of 0.050%), Immigrants from Bulgaria ($93,148, a difference of 0.10%), Immigrants from Spain ($92,732, a difference of 0.34%), and South African ($93,379, a difference of 0.35%).
| Demographics | Rating | Rank | Median Household Income |
| Immigrants | Latvia | 99.6 /100 | #74 | Exceptional $93,602 |
| Immigrants | Italy | 99.5 /100 | #75 | Exceptional $93,465 |
| South Africans | 99.5 /100 | #76 | Exceptional $93,379 |
| Immigrants | Afghanistan | 99.5 /100 | #77 | Exceptional $93,375 |
| Immigrants | Bulgaria | 99.4 /100 | #78 | Exceptional $93,148 |
| Sri Lankans | 99.4 /100 | #79 | Exceptional $93,093 |
| Tongans | 99.4 /100 | #80 | Exceptional $93,076 |
| Immigrants | Eastern Europe | 99.4 /100 | #81 | Exceptional $93,051 |
| Immigrants | Spain | 99.3 /100 | #82 | Exceptional $92,732 |
| Italians | 99.1 /100 | #83 | Exceptional $92,475 |
| Immigrants | Argentina | 99.1 /100 | #84 | Exceptional $92,417 |
| Immigrants | Croatia | 99.0 /100 | #85 | Exceptional $92,225 |
| Immigrants | England | 98.9 /100 | #86 | Exceptional $92,098 |
| Immigrants | Hungary | 98.9 /100 | #87 | Exceptional $92,094 |
| Immigrants | Canada | 98.8 /100 | #88 | Exceptional $92,029 |