Immigrants from Eastern Europe vs American Householder Income Ages 25 - 44 years
COMPARE
Immigrants from Eastern Europe
American
Householder Income Ages 25 - 44 years
Householder Income Ages 25 - 44 years Comparison
Immigrants from Eastern Europe
Americans
$104,662
HOUSEHOLDER INCOME AGES 25 - 44 YEARS
99.6/ 100
METRIC RATING
68th/ 347
METRIC RANK
$84,791
HOUSEHOLDER INCOME AGES 25 - 44 YEARS
0.4/ 100
METRIC RATING
260th/ 347
METRIC RANK
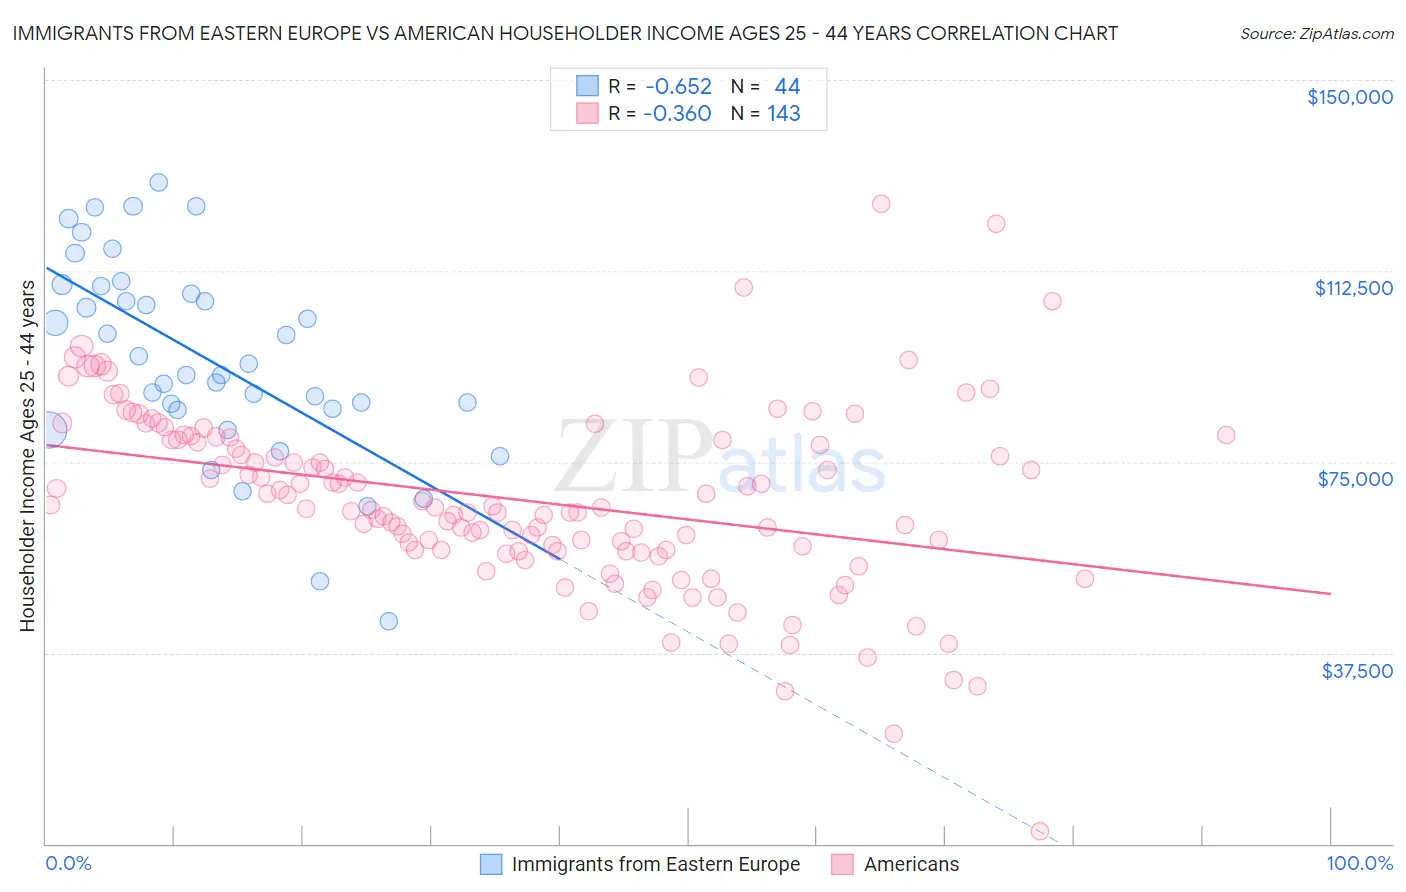
Immigrants from Eastern Europe vs American Householder Income Ages 25 - 44 years Correlation Chart
The statistical analysis conducted on geographies consisting of 473,985,258 people shows a significant negative correlation between the proportion of Immigrants from Eastern Europe and household income with householder between the ages 25 and 44 in the United States with a correlation coefficient (R) of -0.652 and weighted average of $104,662. Similarly, the statistical analysis conducted on geographies consisting of 574,694,718 people shows a mild negative correlation between the proportion of Americans and household income with householder between the ages 25 and 44 in the United States with a correlation coefficient (R) of -0.360 and weighted average of $84,791, a difference of 23.4%.
Householder Income Ages 25 - 44 years Correlation Summary
| Measurement | Immigrants from Eastern Europe | American |
| Minimum | $43,724 | $2,499 |
| Maximum | $129,765 | $125,750 |
| Range | $86,041 | $123,251 |
| Mean | $95,165 | $67,597 |
| Median | $93,230 | $65,930 |
| Interquartile 25% (IQ1) | $85,360 | $57,596 |
| Interquartile 75% (IQ3) | $108,718 | $79,418 |
| Interquartile Range (IQR) | $23,358 | $21,822 |
| Standard Deviation (Sample) | $19,648 | $18,011 |
| Standard Deviation (Population) | $19,424 | $17,948 |
Similar Demographics by Householder Income Ages 25 - 44 years
Demographics Similar to Immigrants from Eastern Europe by Householder Income Ages 25 - 44 years
In terms of householder income ages 25 - 44 years, the demographic groups most similar to Immigrants from Eastern Europe are Immigrants from Romania ($104,713, a difference of 0.050%), Mongolian ($104,578, a difference of 0.080%), Immigrants from Croatia ($104,503, a difference of 0.15%), Afghan ($104,410, a difference of 0.24%), and Laotian ($104,993, a difference of 0.32%).
| Demographics | Rating | Rank | Householder Income Ages 25 - 44 years |
| Lithuanians | 99.7 /100 | #61 | Exceptional $105,223 |
| Immigrants | Italy | 99.7 /100 | #62 | Exceptional $105,201 |
| Immigrants | Scotland | 99.7 /100 | #63 | Exceptional $105,089 |
| New Zealanders | 99.7 /100 | #64 | Exceptional $105,085 |
| Immigrants | Netherlands | 99.7 /100 | #65 | Exceptional $105,082 |
| Laotians | 99.7 /100 | #66 | Exceptional $104,993 |
| Immigrants | Romania | 99.6 /100 | #67 | Exceptional $104,713 |
| Immigrants | Eastern Europe | 99.6 /100 | #68 | Exceptional $104,662 |
| Mongolians | 99.6 /100 | #69 | Exceptional $104,578 |
| Immigrants | Croatia | 99.6 /100 | #70 | Exceptional $104,503 |
| Afghans | 99.6 /100 | #71 | Exceptional $104,410 |
| Chinese | 99.5 /100 | #72 | Exceptional $104,264 |
| Italians | 99.5 /100 | #73 | Exceptional $104,215 |
| Immigrants | Fiji | 99.5 /100 | #74 | Exceptional $103,954 |
| Koreans | 99.4 /100 | #75 | Exceptional $103,824 |
Demographics Similar to Americans by Householder Income Ages 25 - 44 years
In terms of householder income ages 25 - 44 years, the demographic groups most similar to Americans are Immigrants from Senegal ($84,848, a difference of 0.070%), Immigrants from Nicaragua ($84,914, a difference of 0.14%), Inupiat ($84,619, a difference of 0.20%), Cree ($84,574, a difference of 0.26%), and Belizean ($84,534, a difference of 0.30%).
| Demographics | Rating | Rank | Householder Income Ages 25 - 44 years |
| British West Indians | 0.7 /100 | #253 | Tragic $85,565 |
| Immigrants | Laos | 0.7 /100 | #254 | Tragic $85,553 |
| German Russians | 0.6 /100 | #255 | Tragic $85,220 |
| Central Americans | 0.5 /100 | #256 | Tragic $85,144 |
| Mexican American Indians | 0.5 /100 | #257 | Tragic $85,066 |
| Immigrants | Nicaragua | 0.5 /100 | #258 | Tragic $84,914 |
| Immigrants | Senegal | 0.5 /100 | #259 | Tragic $84,848 |
| Americans | 0.4 /100 | #260 | Tragic $84,791 |
| Inupiat | 0.4 /100 | #261 | Tragic $84,619 |
| Cree | 0.4 /100 | #262 | Tragic $84,574 |
| Belizeans | 0.4 /100 | #263 | Tragic $84,534 |
| Osage | 0.4 /100 | #264 | Tragic $84,461 |
| Sudanese | 0.4 /100 | #265 | Tragic $84,401 |
| Immigrants | Cabo Verde | 0.3 /100 | #266 | Tragic $84,304 |
| Hmong | 0.3 /100 | #267 | Tragic $84,258 |