Immigrants from Eastern Africa vs Immigrants from Lebanon Householder Income Ages 45 - 64 years

COMPARE

Immigrants from Eastern Africa
Race
Ancestry
AfghanAfricanAlaska NativeAlaskan AthabascanAlbanianAleutAlsatianAmericanApacheArabArapahoArgentineanArmenianAssyrian/Chaldean/SyriacAustralianAustrianBahamianBangladeshiBarbadianBasqueBelgianBelizeanBermudanBhutaneseBlackfeetBolivianBrazilianBritishBritish West IndianBulgarianBurmeseCajunCambodianCanadianCape VerdeanCarpatho RusynCelticCentral AmericanCentral American IndianCherokeeCheyenneChickasawChileanChineseChippewaChoctawColombianColvilleComancheCosta RicanCreeCreekCroatianCrowCubanCypriotCzechCzechoslovakianDanishDelawareDominicanDutchDutch West IndianEastern EuropeanEcuadorianEgyptianEnglishEstonianEthiopianEuropeanFijianFilipinoFinnishFrenchFrench American IndianFrench CanadianGermanGerman RussianGhanaianGreekGuamanian/ChamorroGuatemalanGuyaneseHaitianHmongHonduranHopiHoumaHungarianIcelanderIndian (Asian)IndonesianInupiatIranianIraqiIrishIroquoisIsraeliItalianJamaicanJapaneseJordanianKenyanKiowaKoreanLaotianLatvianLebaneseLiberianLithuanianLumbeeLuxembourgerMacedonianMalaysianMalteseMarshalleseMenomineeMexicanMexican American IndianMongolianMoroccanNative HawaiianNavajoNepaleseNew ZealanderNicaraguanNigerianNorthern EuropeanNorwegianOkinawanOsageOttawaPaiutePakistaniPalestinianPanamanianParaguayanPennsylvania GermanPeruvianPimaPolishPortuguesePotawatomiPuebloPuerto RicanPuget Sound SalishRomanianRussianSalvadoranSamoanScandinavianScotch-IrishScottishSeminoleSenegaleseSerbianShoshoneSierra LeoneanSiouxSlavicSlovakSloveneSomaliSouth AfricanSouth AmericanSouth American IndianSoviet UnionSpaniardSpanishSpanish AmericanSpanish American IndianSri LankanSubsaharan AfricanSudaneseSwedishSwissSyrianTaiwaneseThaiTlingit-HaidaTohono O'OdhamTonganTrinidadian and TobagonianTsimshianTurkishU.S. Virgin IslanderUgandanUkrainianUruguayanUteVenezuelanVietnameseWelshWest IndianYakamaYaquiYugoslavianYumanYup'ikZimbabwean
Immigration
NonimmigrantsImmigrantsAfghanistanAfricaAlbaniaArgentinaArmeniaAsiaAustraliaAustriaBahamasBangladeshBarbadosBelarusBelgiumBelizeBoliviaBosnia and HerzegovinaBrazilBulgariaBurma/MyanmarCabo VerdeCambodiaCameroonCanadaCaribbeanCentral AmericaChileChinaColombiaCongoCosta RicaCroatiaCubaCzechoslovakiaDenmarkDominicaDominican RepublicEastern AfricaEastern AsiaEastern EuropeEcuadorEgyptEl SalvadorEnglandEritreaEthiopiaEuropeFijiFranceGermanyGhanaGreeceGrenadaGuatemalaGuyanaHaitiHondurasHong KongHungaryIndiaIndonesiaIranIraqIrelandIsraelItalyJamaicaJapanJordanKazakhstanKenyaKoreaKuwaitLaosLatin AmericaLatviaLiberiaLithuaniaMalaysiaMexicoMicronesiaMiddle AfricaMoldovaMoroccoNepalNetherlandsNicaraguaNigeriaNorth AmericaNorth MacedoniaNorthern AfricaNorthern EuropeNorwayOceaniaPakistanPanamaPeruPhilippinesPolandPortugalRomaniaRussiaSaudi ArabiaScotlandSenegalSerbiaSierra LeoneSingaporeSomaliaSouth AfricaSouth AmericaSouth Central AsiaSouth Eastern AsiaSouthern EuropeSpainSri LankaSt. Vincent and the GrenadinesSudanSwedenSwitzerlandSyriaTaiwanThailandTrinidad and TobagoTurkeyUgandaUkraineUruguayUzbekistanVenezuelaVietnamWest IndiesWestern AfricaWestern AsiaWestern EuropeYemenZaireZimbabweAzores
Immigrants from Lebanon
Race
Ancestry
AfghanAfricanAlaska NativeAlaskan AthabascanAlbanianAleutAlsatianAmericanApacheArabArapahoArgentineanArmenianAssyrian/Chaldean/SyriacAustralianAustrianBahamianBangladeshiBarbadianBasqueBelgianBelizeanBermudanBhutaneseBlackfeetBolivianBrazilianBritishBritish West IndianBulgarianBurmeseCajunCambodianCanadianCape VerdeanCarpatho RusynCelticCentral AmericanCentral American IndianCherokeeCheyenneChickasawChileanChineseChippewaChoctawColombianColvilleComancheCosta RicanCreeCreekCroatianCrowCubanCypriotCzechCzechoslovakianDanishDelawareDominicanDutchDutch West IndianEastern EuropeanEcuadorianEgyptianEnglishEstonianEthiopianEuropeanFijianFilipinoFinnishFrenchFrench American IndianFrench CanadianGermanGerman RussianGhanaianGreekGuamanian/ChamorroGuatemalanGuyaneseHaitianHmongHonduranHopiHoumaHungarianIcelanderIndian (Asian)IndonesianInupiatIranianIraqiIrishIroquoisIsraeliItalianJamaicanJapaneseJordanianKenyanKiowaKoreanLaotianLatvianLebaneseLiberianLithuanianLumbeeLuxembourgerMacedonianMalaysianMalteseMarshalleseMenomineeMexicanMexican American IndianMongolianMoroccanNative HawaiianNavajoNepaleseNew ZealanderNicaraguanNigerianNorthern EuropeanNorwegianOkinawanOsageOttawaPaiutePakistaniPalestinianPanamanianParaguayanPennsylvania GermanPeruvianPimaPolishPortuguesePotawatomiPuebloPuerto RicanPuget Sound SalishRomanianRussianSalvadoranSamoanScandinavianScotch-IrishScottishSeminoleSenegaleseSerbianShoshoneSierra LeoneanSiouxSlavicSlovakSloveneSomaliSouth AfricanSouth AmericanSouth American IndianSoviet UnionSpaniardSpanishSpanish AmericanSpanish American IndianSri LankanSubsaharan AfricanSudaneseSwedishSwissSyrianTaiwaneseThaiTlingit-HaidaTohono O'OdhamTonganTrinidadian and TobagonianTsimshianTurkishU.S. Virgin IslanderUgandanUkrainianUruguayanUteVenezuelanVietnameseWelshWest IndianYakamaYaquiYugoslavianYumanYup'ikZimbabwean
Immigration
NonimmigrantsImmigrantsAfghanistanAfricaAlbaniaArgentinaArmeniaAsiaAustraliaAustriaBahamasBangladeshBarbadosBelarusBelgiumBelizeBoliviaBosnia and HerzegovinaBrazilBulgariaBurma/MyanmarCabo VerdeCambodiaCameroonCanadaCaribbeanCentral AmericaChileChinaColombiaCongoCosta RicaCroatiaCubaCzechoslovakiaDenmarkDominicaDominican RepublicEastern AsiaEastern EuropeEcuadorEgyptEl SalvadorEnglandEritreaEthiopiaEuropeFijiFranceGermanyGhanaGreeceGrenadaGuatemalaGuyanaHaitiHondurasHong KongHungaryIndiaIndonesiaIranIraqIrelandIsraelItalyJamaicaJapanJordanKazakhstanKenyaKoreaKuwaitLaosLatin AmericaLatviaLebanonLiberiaLithuaniaMalaysiaMexicoMicronesiaMiddle AfricaMoldovaMoroccoNepalNetherlandsNicaraguaNigeriaNorth AmericaNorth MacedoniaNorthern AfricaNorthern EuropeNorwayOceaniaPakistanPanamaPeruPhilippinesPolandPortugalRomaniaRussiaSaudi ArabiaScotlandSenegalSerbiaSierra LeoneSingaporeSomaliaSouth AfricaSouth AmericaSouth Central AsiaSouth Eastern AsiaSouthern EuropeSpainSri LankaSt. Vincent and the GrenadinesSudanSwedenSwitzerlandSyriaTaiwanThailandTrinidad and TobagoTurkeyUgandaUkraineUruguayUzbekistanVenezuelaVietnamWest IndiesWestern AfricaWestern AsiaWestern EuropeYemenZaireZimbabweAzores
Householder Income Ages 45 - 64 years
Income
Poverty
Unemployment
Labor Participation
Family Structure
Vehicle Availability
Education Level
Disability

Householder Income Ages 45 - 64 years Comparison

Immigrants from Eastern Africa

Immigrants from Lebanon

Fair
Exceptional
$98,467
HOUSEHOLDER INCOME AGES 45 - 64 YEARS
28.3/ 100
METRIC RATING
196th/ 347
METRIC RANK
$108,471
HOUSEHOLDER INCOME AGES 45 - 64 YEARS
98.3/ 100
METRIC RATING
91st/ 347
METRIC RANK

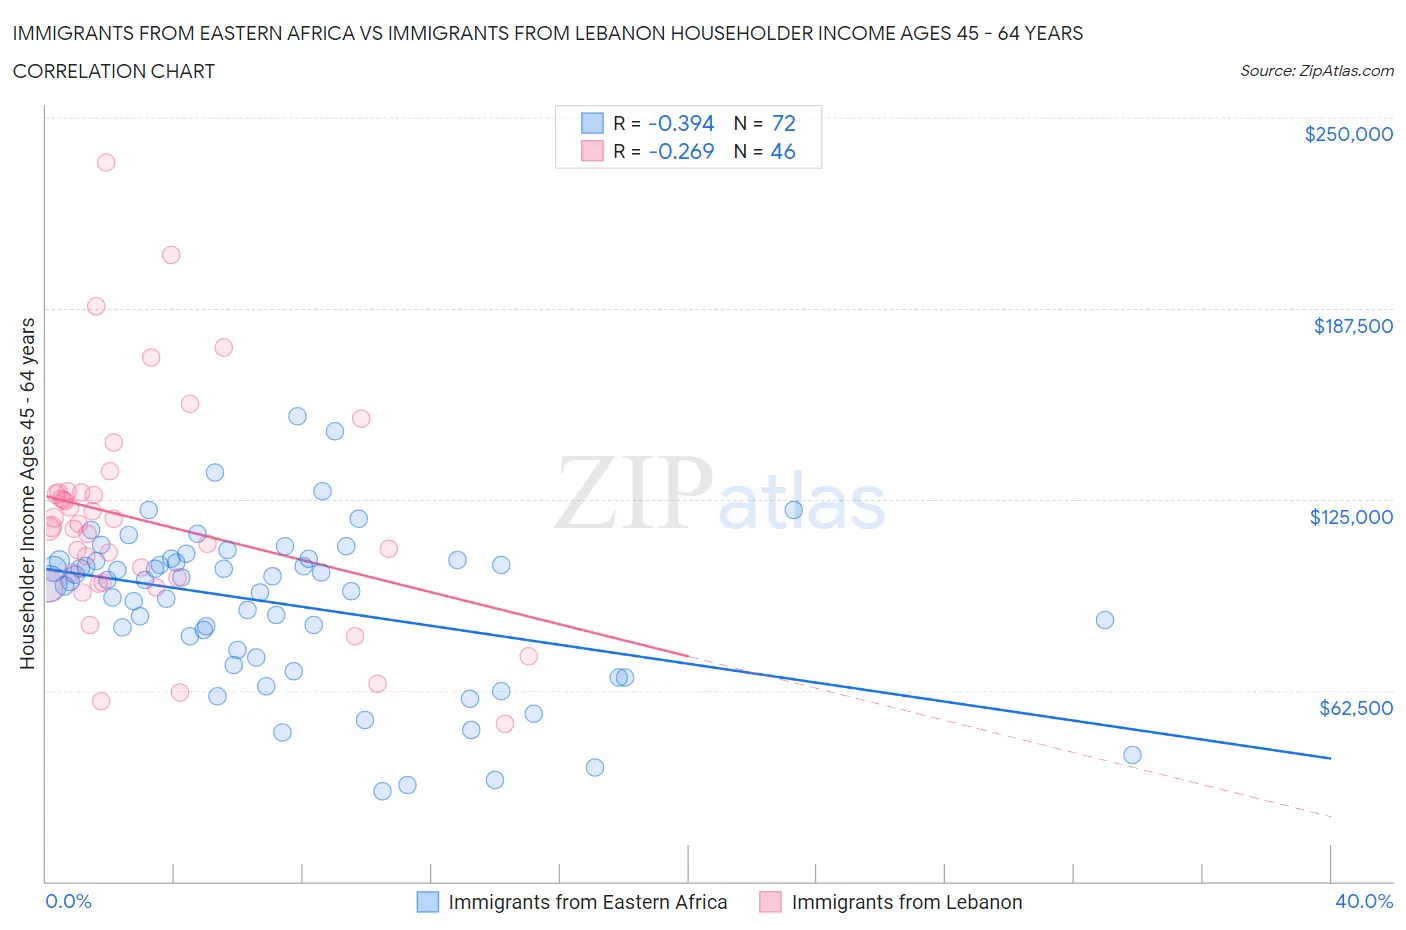
Immigrants from Eastern Africa vs Immigrants from Lebanon Householder Income Ages 45 - 64 years Correlation Chart

The statistical analysis conducted on geographies consisting of 354,576,754 people shows a mild negative correlation between the proportion of Immigrants from Eastern Africa and household income with householder between the ages 45 and 64 in the United States with a correlation coefficient (R) of -0.394 and weighted average of $98,467. Similarly, the statistical analysis conducted on geographies consisting of 217,063,471 people shows a weak negative correlation between the proportion of Immigrants from Lebanon and household income with householder between the ages 45 and 64 in the United States with a correlation coefficient (R) of -0.269 and weighted average of $108,471, a difference of 10.2%.
Immigrants from Eastern Africa vs Immigrants from Lebanon Householder Income Ages 45 - 64 years

Householder Income Ages 45 - 64 years Correlation Summary

MeasurementImmigrants from Eastern AfricaImmigrants from Lebanon
Minimum$29,590$51,559
Maximum$152,098$235,112
Range$122,508$183,553
Mean$90,687$118,072
Median$98,438$115,795
Interquartile 25% (IQ1)$74,490$97,661
Interquartile 75% (IQ3)$104,938$127,190
Interquartile Range (IQR)$30,447$29,528
Standard Deviation (Sample)$25,936$36,074
Standard Deviation (Population)$25,755$35,680

Similar Demographics by Householder Income Ages 45 - 64 years

Demographics Similar to Immigrants from Eastern Africa by Householder Income Ages 45 - 64 years

In terms of householder income ages 45 - 64 years, the demographic groups most similar to Immigrants from Eastern Africa are Spanish ($98,554, a difference of 0.090%), Puget Sound Salish ($98,340, a difference of 0.13%), Uruguayan ($98,660, a difference of 0.20%), Immigrants from Iraq ($98,201, a difference of 0.27%), and Hawaiian ($98,778, a difference of 0.32%).
DemographicsRating | RankHouseholder Income Ages 45 - 64 years
Immigrants | South America
35.4
/100
|
#189
Fair
$99,126
French Canadians
35.1
/100
|
#190
Fair
$99,093
Kenyans
33.7
/100
|
#191
Fair
$98,970
Celtics
32.9
/100
|
#192
Fair
$98,896
Hawaiians
31.6
/100
|
#193
Fair
$98,778
Uruguayans
30.3
/100
|
#194
Fair
$98,660
Spanish
29.2
/100
|
#195
Fair
$98,554
Immigrants | Eastern Africa
28.3
/100
|
#196
Fair
$98,467
Puget Sound Salish
27.0
/100
|
#197
Fair
$98,340
Immigrants | Iraq
25.7
/100
|
#198
Fair
$98,201
Whites/Caucasians
24.6
/100
|
#199
Fair
$98,091
Immigrants | Kenya
23.5
/100
|
#200
Fair
$97,964
Yugoslavians
20.0
/100
|
#201
Fair
$97,558
Tlingit-Haida
18.9
/100
|
#202
Poor
$97,417
Immigrants | Thailand
18.8
/100
|
#203
Poor
$97,400

Demographics Similar to Immigrants from Lebanon by Householder Income Ages 45 - 64 years

In terms of householder income ages 45 - 64 years, the demographic groups most similar to Immigrants from Lebanon are Ukrainian ($108,475, a difference of 0.0%), Immigrants from Philippines ($108,471, a difference of 0.0%), Croatian ($108,383, a difference of 0.080%), Romanian ($108,609, a difference of 0.13%), and Immigrants from Croatia ($108,304, a difference of 0.15%).
DemographicsRating | RankHouseholder Income Ages 45 - 64 years
Immigrants | Western Europe
98.6
/100
|
#84
Exceptional
$108,824
Immigrants | Afghanistan
98.6
/100
|
#85
Exceptional
$108,785
Austrians
98.5
/100
|
#86
Exceptional
$108,692
Tongans
98.5
/100
|
#87
Exceptional
$108,643
Romanians
98.5
/100
|
#88
Exceptional
$108,609
Ukrainians
98.3
/100
|
#89
Exceptional
$108,475
Immigrants | Philippines
98.3
/100
|
#90
Exceptional
$108,471
Immigrants | Lebanon
98.3
/100
|
#91
Exceptional
$108,471
Croatians
98.3
/100
|
#92
Exceptional
$108,383
Immigrants | Croatia
98.2
/100
|
#93
Exceptional
$108,304
Sri Lankans
98.2
/100
|
#94
Exceptional
$108,270
Immigrants | Hungary
98.2
/100
|
#95
Exceptional
$108,267
Immigrants | Argentina
98.2
/100
|
#96
Exceptional
$108,264
Northern Europeans
97.8
/100
|
#97
Exceptional
$107,870
Immigrants | Southern Europe
97.7
/100
|
#98
Exceptional
$107,775