Immigrants from Eastern Africa vs Immigrants from Dominican Republic Median Female Earnings
COMPARE
Immigrants from Eastern Africa
Immigrants from Dominican Republic
Median Female Earnings
Median Female Earnings Comparison
Immigrants from Eastern Africa
Immigrants from Dominican Republic
$40,644
MEDIAN FEMALE EARNINGS
87.7/ 100
METRIC RATING
136th/ 347
METRIC RANK
$36,857
MEDIAN FEMALE EARNINGS
0.3/ 100
METRIC RATING
272nd/ 347
METRIC RANK
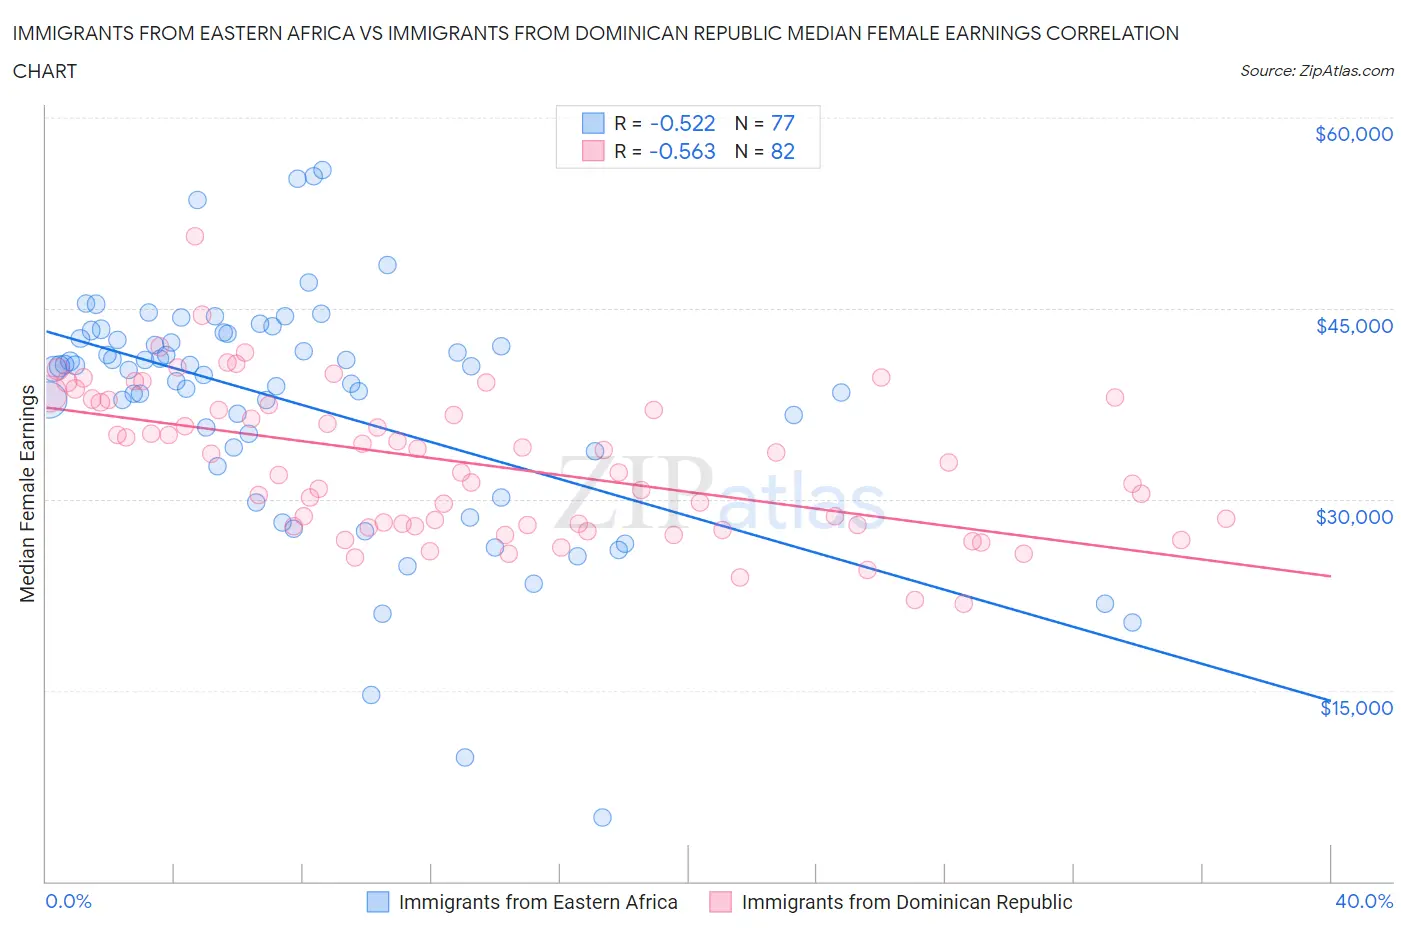
Immigrants from Eastern Africa vs Immigrants from Dominican Republic Median Female Earnings Correlation Chart
The statistical analysis conducted on geographies consisting of 355,081,217 people shows a substantial negative correlation between the proportion of Immigrants from Eastern Africa and median female earnings in the United States with a correlation coefficient (R) of -0.522 and weighted average of $40,644. Similarly, the statistical analysis conducted on geographies consisting of 275,036,579 people shows a substantial negative correlation between the proportion of Immigrants from Dominican Republic and median female earnings in the United States with a correlation coefficient (R) of -0.563 and weighted average of $36,857, a difference of 10.3%.
Median Female Earnings Correlation Summary
| Measurement | Immigrants from Eastern Africa | Immigrants from Dominican Republic |
| Minimum | $5,000 | $21,771 |
| Maximum | $55,898 | $50,664 |
| Range | $50,898 | $28,893 |
| Mean | $37,373 | $32,854 |
| Median | $40,248 | $32,506 |
| Interquartile 25% (IQ1) | $33,197 | $27,940 |
| Interquartile 75% (IQ3) | $42,814 | $37,608 |
| Interquartile Range (IQR) | $9,617 | $9,668 |
| Standard Deviation (Sample) | $9,538 | $5,745 |
| Standard Deviation (Population) | $9,476 | $5,709 |
Similar Demographics by Median Female Earnings
Demographics Similar to Immigrants from Eastern Africa by Median Female Earnings
In terms of median female earnings, the demographic groups most similar to Immigrants from Eastern Africa are Pakistani ($40,596, a difference of 0.12%), Immigrants from Nepal ($40,704, a difference of 0.15%), Taiwanese ($40,576, a difference of 0.17%), Arab ($40,718, a difference of 0.18%), and Syrian ($40,727, a difference of 0.20%).
| Demographics | Rating | Rank | Median Female Earnings |
| Zimbabweans | 90.8 /100 | #129 | Exceptional $40,798 |
| Immigrants | Guyana | 90.3 /100 | #130 | Exceptional $40,773 |
| Chileans | 90.0 /100 | #131 | Exceptional $40,757 |
| Immigrants | Uganda | 89.7 /100 | #132 | Excellent $40,739 |
| Syrians | 89.5 /100 | #133 | Excellent $40,727 |
| Arabs | 89.3 /100 | #134 | Excellent $40,718 |
| Immigrants | Nepal | 89.0 /100 | #135 | Excellent $40,704 |
| Immigrants | Eastern Africa | 87.7 /100 | #136 | Excellent $40,644 |
| Pakistanis | 86.6 /100 | #137 | Excellent $40,596 |
| Taiwanese | 86.1 /100 | #138 | Excellent $40,576 |
| Immigrants | South Eastern Asia | 85.7 /100 | #139 | Excellent $40,558 |
| Serbians | 85.2 /100 | #140 | Excellent $40,539 |
| Immigrants | Syria | 84.1 /100 | #141 | Excellent $40,499 |
| Sri Lankans | 84.0 /100 | #142 | Excellent $40,496 |
| Northern Europeans | 83.9 /100 | #143 | Excellent $40,491 |
Demographics Similar to Immigrants from Dominican Republic by Median Female Earnings
In terms of median female earnings, the demographic groups most similar to Immigrants from Dominican Republic are Immigrants from Laos ($36,841, a difference of 0.040%), Nicaraguan ($36,904, a difference of 0.13%), French American Indian ($36,920, a difference of 0.17%), Immigrants from Venezuela ($37,003, a difference of 0.39%), and Cree ($37,018, a difference of 0.44%).
| Demographics | Rating | Rank | Median Female Earnings |
| Immigrants | Belize | 0.4 /100 | #265 | Tragic $37,056 |
| Dominicans | 0.4 /100 | #266 | Tragic $37,046 |
| Immigrants | Nonimmigrants | 0.4 /100 | #267 | Tragic $37,024 |
| Cree | 0.4 /100 | #268 | Tragic $37,018 |
| Immigrants | Venezuela | 0.4 /100 | #269 | Tragic $37,003 |
| French American Indians | 0.3 /100 | #270 | Tragic $36,920 |
| Nicaraguans | 0.3 /100 | #271 | Tragic $36,904 |
| Immigrants | Dominican Republic | 0.3 /100 | #272 | Tragic $36,857 |
| Immigrants | Laos | 0.3 /100 | #273 | Tragic $36,841 |
| Immigrants | El Salvador | 0.2 /100 | #274 | Tragic $36,673 |
| Africans | 0.1 /100 | #275 | Tragic $36,530 |
| Central Americans | 0.1 /100 | #276 | Tragic $36,492 |
| Marshallese | 0.1 /100 | #277 | Tragic $36,459 |
| U.S. Virgin Islanders | 0.1 /100 | #278 | Tragic $36,424 |
| Immigrants | Caribbean | 0.1 /100 | #279 | Tragic $36,414 |