Immigrants from Dominican Republic vs American Median Earnings
COMPARE
Immigrants from Dominican Republic
American
Median Earnings
Median Earnings Comparison
Immigrants from Dominican Republic
Americans
$41,554
MEDIAN EARNINGS
0.1/ 100
METRIC RATING
288th/ 347
METRIC RANK
$42,742
MEDIAN EARNINGS
0.6/ 100
METRIC RATING
268th/ 347
METRIC RANK
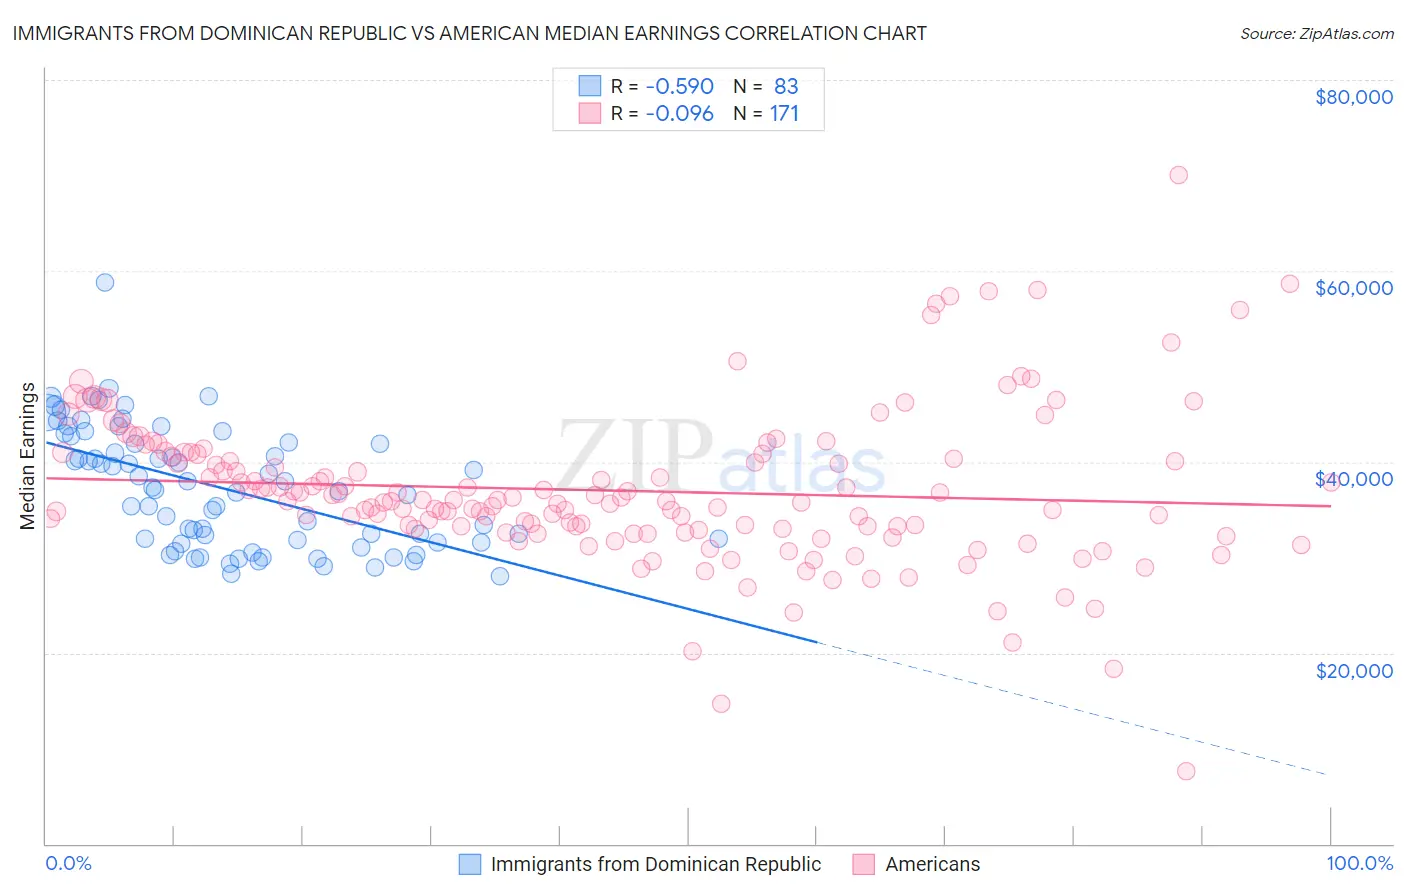
Immigrants from Dominican Republic vs American Median Earnings Correlation Chart
The statistical analysis conducted on geographies consisting of 275,134,235 people shows a substantial negative correlation between the proportion of Immigrants from Dominican Republic and median earnings in the United States with a correlation coefficient (R) of -0.590 and weighted average of $41,554. Similarly, the statistical analysis conducted on geographies consisting of 581,345,964 people shows a slight negative correlation between the proportion of Americans and median earnings in the United States with a correlation coefficient (R) of -0.096 and weighted average of $42,742, a difference of 2.9%.
Median Earnings Correlation Summary
| Measurement | Immigrants from Dominican Republic | American |
| Minimum | $28,009 | $7,598 |
| Maximum | $58,780 | $70,000 |
| Range | $30,771 | $62,402 |
| Mean | $37,276 | $36,993 |
| Median | $37,042 | $35,919 |
| Interquartile 25% (IQ1) | $31,535 | $32,980 |
| Interquartile 75% (IQ3) | $42,082 | $40,815 |
| Interquartile Range (IQR) | $10,547 | $7,835 |
| Standard Deviation (Sample) | $6,269 | $8,064 |
| Standard Deviation (Population) | $6,231 | $8,040 |
Demographics Similar to Immigrants from Dominican Republic and Americans by Median Earnings
In terms of median earnings, the demographic groups most similar to Immigrants from Dominican Republic are Indonesian ($41,701, a difference of 0.35%), Mexican American Indian ($41,719, a difference of 0.40%), Immigrants from Nicaragua ($41,737, a difference of 0.44%), Blackfeet ($41,822, a difference of 0.64%), and Dominican ($41,864, a difference of 0.75%). Similarly, the demographic groups most similar to Americans are Belizean ($42,702, a difference of 0.090%), Osage ($42,651, a difference of 0.21%), Pennsylvania German ($42,615, a difference of 0.30%), Iroquois ($42,430, a difference of 0.73%), and Immigrants from Dominica ($42,420, a difference of 0.76%).
| Demographics | Rating | Rank | Median Earnings |
| Americans | 0.6 /100 | #268 | Tragic $42,742 |
| Belizeans | 0.5 /100 | #269 | Tragic $42,702 |
| Osage | 0.5 /100 | #270 | Tragic $42,651 |
| Pennsylvania Germans | 0.5 /100 | #271 | Tragic $42,615 |
| Iroquois | 0.4 /100 | #272 | Tragic $42,430 |
| Immigrants | Dominica | 0.4 /100 | #273 | Tragic $42,420 |
| Immigrants | El Salvador | 0.4 /100 | #274 | Tragic $42,413 |
| Immigrants | Belize | 0.3 /100 | #275 | Tragic $42,339 |
| Spanish Americans | 0.3 /100 | #276 | Tragic $42,316 |
| Central Americans | 0.3 /100 | #277 | Tragic $42,280 |
| Cajuns | 0.3 /100 | #278 | Tragic $42,189 |
| Colville | 0.2 /100 | #279 | Tragic $42,151 |
| Hmong | 0.2 /100 | #280 | Tragic $42,111 |
| Marshallese | 0.2 /100 | #281 | Tragic $41,969 |
| Africans | 0.2 /100 | #282 | Tragic $41,955 |
| Dominicans | 0.2 /100 | #283 | Tragic $41,864 |
| Blackfeet | 0.2 /100 | #284 | Tragic $41,822 |
| Immigrants | Nicaragua | 0.1 /100 | #285 | Tragic $41,737 |
| Mexican American Indians | 0.1 /100 | #286 | Tragic $41,719 |
| Indonesians | 0.1 /100 | #287 | Tragic $41,701 |
| Immigrants | Dominican Republic | 0.1 /100 | #288 | Tragic $41,554 |