Immigrants from Dominica vs Ute Median Household Income
COMPARE
Immigrants from Dominica
Ute
Median Household Income
Median Household Income Comparison
Immigrants from Dominica
Ute
$72,760
MEDIAN HOUSEHOLD INCOME
0.0/ 100
METRIC RATING
300th/ 347
METRIC RANK
$72,402
MEDIAN HOUSEHOLD INCOME
0.0/ 100
METRIC RATING
307th/ 347
METRIC RANK
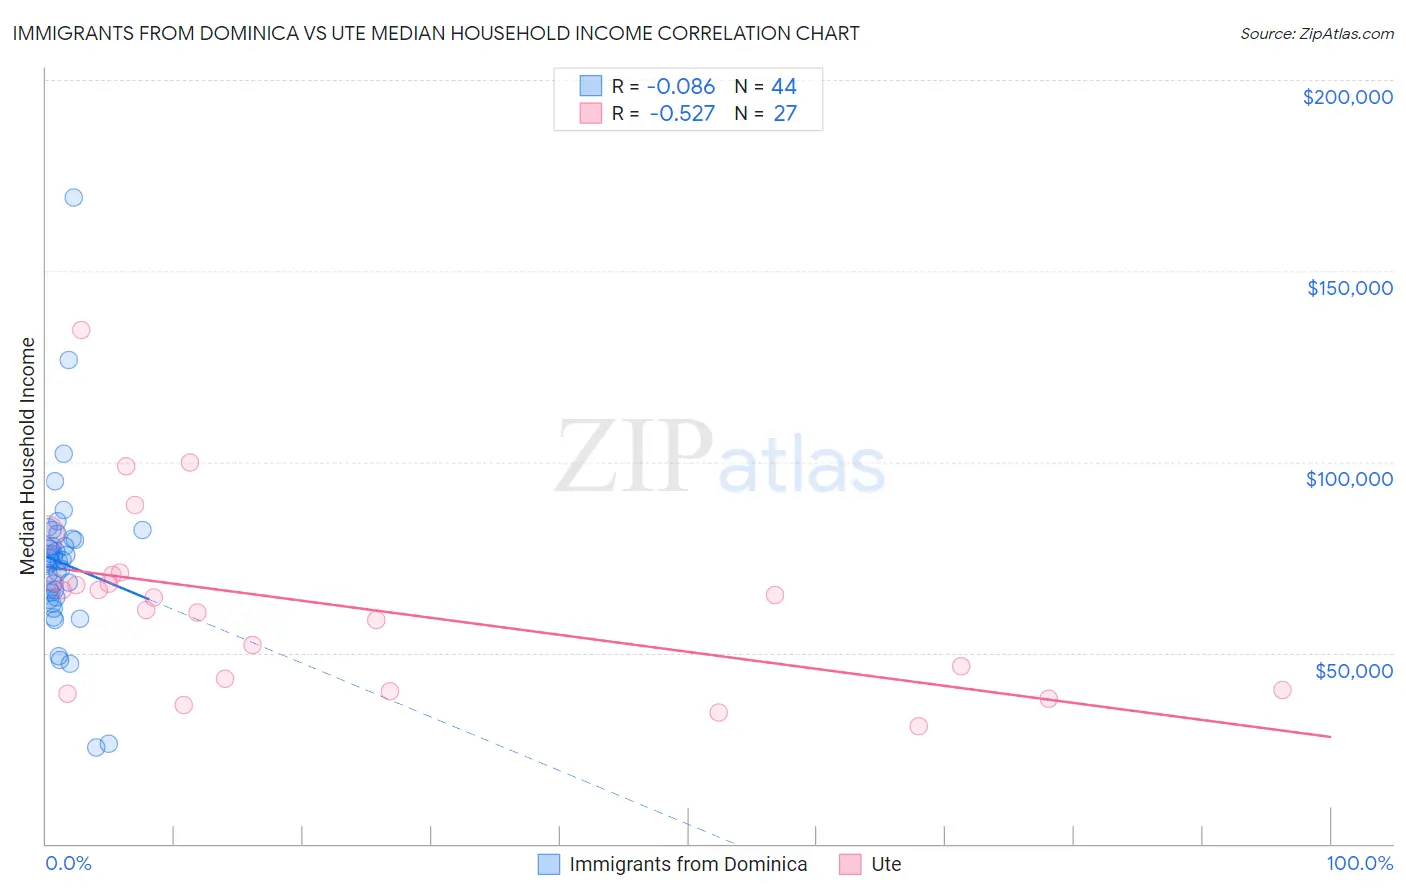
Immigrants from Dominica vs Ute Median Household Income Correlation Chart
The statistical analysis conducted on geographies consisting of 83,788,429 people shows a slight negative correlation between the proportion of Immigrants from Dominica and median household income in the United States with a correlation coefficient (R) of -0.086 and weighted average of $72,760. Similarly, the statistical analysis conducted on geographies consisting of 55,657,610 people shows a substantial negative correlation between the proportion of Ute and median household income in the United States with a correlation coefficient (R) of -0.527 and weighted average of $72,402, a difference of 0.49%.
Median Household Income Correlation Summary
| Measurement | Immigrants from Dominica | Ute |
| Minimum | $25,050 | $30,694 |
| Maximum | $169,141 | $134,629 |
| Range | $144,091 | $103,935 |
| Mean | $73,512 | $62,668 |
| Median | $74,253 | $64,375 |
| Interquartile 25% (IQ1) | $64,327 | $40,417 |
| Interquartile 75% (IQ3) | $79,686 | $70,252 |
| Interquartile Range (IQR) | $15,359 | $29,835 |
| Standard Deviation (Sample) | $22,542 | $23,676 |
| Standard Deviation (Population) | $22,284 | $23,234 |
Demographics Similar to Immigrants from Dominica and Ute by Median Household Income
In terms of median household income, the demographic groups most similar to Immigrants from Dominica are Cherokee ($72,682, a difference of 0.11%), Indonesian ($72,856, a difference of 0.13%), Shoshone ($72,660, a difference of 0.14%), African ($72,650, a difference of 0.15%), and Immigrants from Haiti ($72,599, a difference of 0.22%). Similarly, the demographic groups most similar to Ute are Potawatomi ($72,576, a difference of 0.24%), Yakama ($72,225, a difference of 0.25%), Honduran ($72,588, a difference of 0.26%), Immigrants from Haiti ($72,599, a difference of 0.27%), and African ($72,650, a difference of 0.34%).
| Demographics | Rating | Rank | Median Household Income |
| Immigrants | Cabo Verde | 0.1 /100 | #293 | Tragic $73,515 |
| Blackfeet | 0.1 /100 | #294 | Tragic $73,509 |
| Cubans | 0.1 /100 | #295 | Tragic $73,392 |
| Haitians | 0.1 /100 | #296 | Tragic $73,306 |
| Immigrants | Mexico | 0.0 /100 | #297 | Tragic $73,160 |
| Paiute | 0.0 /100 | #298 | Tragic $72,959 |
| Indonesians | 0.0 /100 | #299 | Tragic $72,856 |
| Immigrants | Dominica | 0.0 /100 | #300 | Tragic $72,760 |
| Cherokee | 0.0 /100 | #301 | Tragic $72,682 |
| Shoshone | 0.0 /100 | #302 | Tragic $72,660 |
| Africans | 0.0 /100 | #303 | Tragic $72,650 |
| Immigrants | Haiti | 0.0 /100 | #304 | Tragic $72,599 |
| Hondurans | 0.0 /100 | #305 | Tragic $72,588 |
| Potawatomi | 0.0 /100 | #306 | Tragic $72,576 |
| Ute | 0.0 /100 | #307 | Tragic $72,402 |
| Yakama | 0.0 /100 | #308 | Tragic $72,225 |
| Immigrants | Caribbean | 0.0 /100 | #309 | Tragic $71,860 |
| U.S. Virgin Islanders | 0.0 /100 | #310 | Tragic $71,853 |
| Immigrants | Zaire | 0.0 /100 | #311 | Tragic $71,801 |
| Immigrants | Honduras | 0.0 /100 | #312 | Tragic $71,452 |
| Immigrants | Bahamas | 0.0 /100 | #313 | Tragic $71,349 |