Immigrants from Dominica vs Fijian Median Family Income
COMPARE
Immigrants from Dominica
Fijian
Median Family Income
Median Family Income Comparison
Immigrants from Dominica
Fijians
$85,411
MEDIAN FAMILY INCOME
0.0/ 100
METRIC RATING
306th/ 347
METRIC RANK
$87,387
MEDIAN FAMILY INCOME
0.0/ 100
METRIC RATING
294th/ 347
METRIC RANK
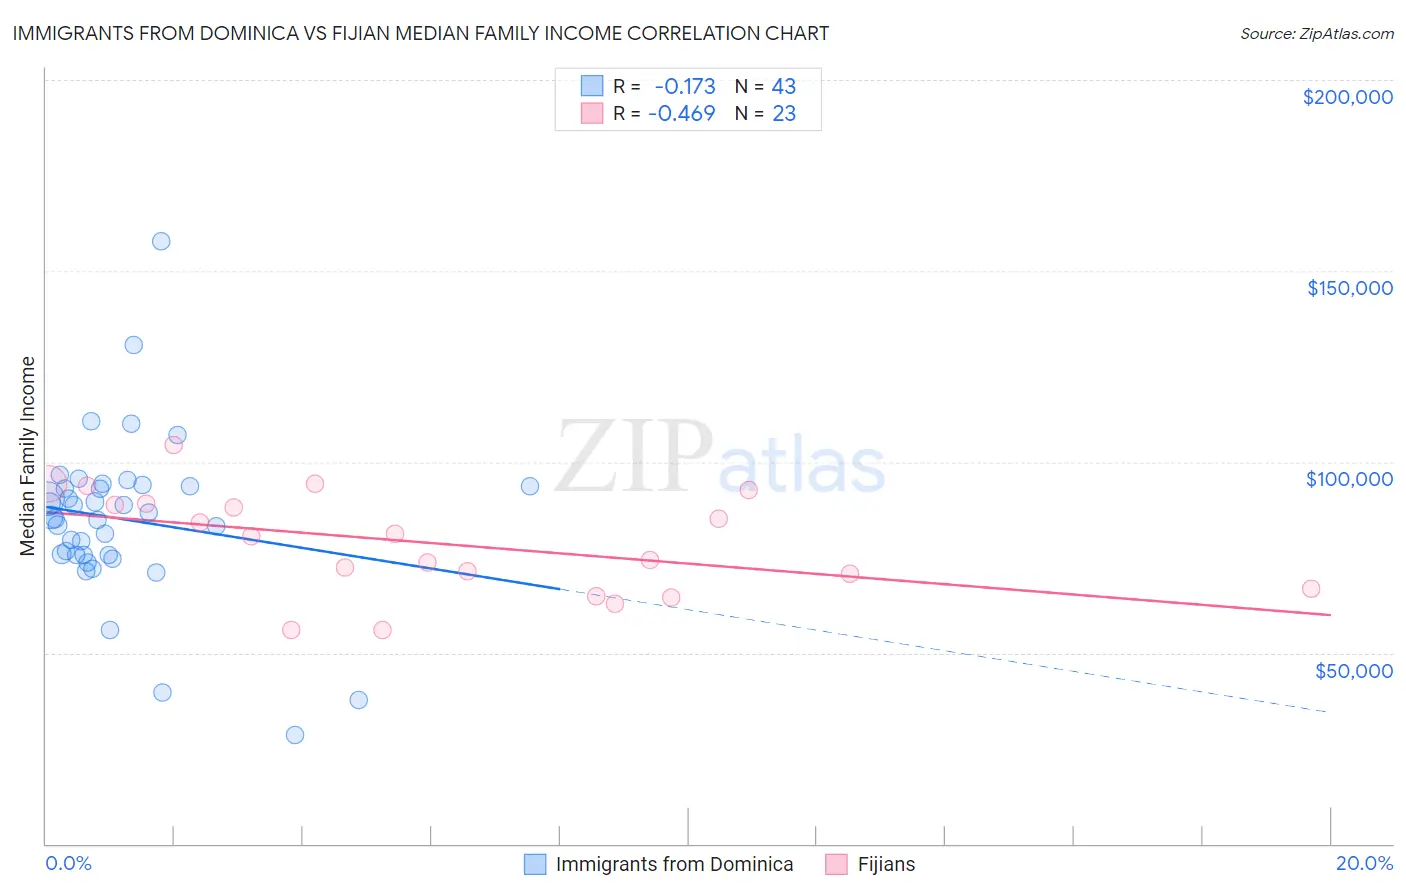
Immigrants from Dominica vs Fijian Median Family Income Correlation Chart
The statistical analysis conducted on geographies consisting of 83,779,139 people shows a poor negative correlation between the proportion of Immigrants from Dominica and median family income in the United States with a correlation coefficient (R) of -0.173 and weighted average of $85,411. Similarly, the statistical analysis conducted on geographies consisting of 55,946,812 people shows a moderate negative correlation between the proportion of Fijians and median family income in the United States with a correlation coefficient (R) of -0.469 and weighted average of $87,387, a difference of 2.3%.
Median Family Income Correlation Summary
| Measurement | Immigrants from Dominica | Fijian |
| Minimum | $28,616 | $55,821 |
| Maximum | $157,838 | $104,335 |
| Range | $129,222 | $48,514 |
| Mean | $84,989 | $78,636 |
| Median | $85,349 | $80,363 |
| Interquartile 25% (IQ1) | $75,527 | $66,750 |
| Interquartile 75% (IQ3) | $93,750 | $89,066 |
| Interquartile Range (IQR) | $18,223 | $22,316 |
| Standard Deviation (Sample) | $21,651 | $13,442 |
| Standard Deviation (Population) | $21,398 | $13,146 |
Demographics Similar to Immigrants from Dominica and Fijians by Median Family Income
In terms of median family income, the demographic groups most similar to Immigrants from Dominica are Paiute ($85,414, a difference of 0.0%), Chickasaw ($85,356, a difference of 0.060%), U.S. Virgin Islander ($85,294, a difference of 0.14%), Haitian ($85,218, a difference of 0.23%), and Mexican ($85,618, a difference of 0.24%). Similarly, the demographic groups most similar to Fijians are Yaqui ($87,289, a difference of 0.11%), Immigrants from Guatemala ($87,191, a difference of 0.22%), Ute ($87,596, a difference of 0.24%), Cajun ($87,157, a difference of 0.26%), and Immigrants from Latin America ($86,989, a difference of 0.46%).
| Demographics | Rating | Rank | Median Family Income |
| Shoshone | 0.1 /100 | #290 | Tragic $87,872 |
| Immigrants | Cabo Verde | 0.1 /100 | #291 | Tragic $87,830 |
| Africans | 0.1 /100 | #292 | Tragic $87,820 |
| Ute | 0.0 /100 | #293 | Tragic $87,596 |
| Fijians | 0.0 /100 | #294 | Tragic $87,387 |
| Yaqui | 0.0 /100 | #295 | Tragic $87,289 |
| Immigrants | Guatemala | 0.0 /100 | #296 | Tragic $87,191 |
| Cajuns | 0.0 /100 | #297 | Tragic $87,157 |
| Immigrants | Latin America | 0.0 /100 | #298 | Tragic $86,989 |
| Chippewa | 0.0 /100 | #299 | Tragic $86,852 |
| Ottawa | 0.0 /100 | #300 | Tragic $86,380 |
| Colville | 0.0 /100 | #301 | Tragic $85,792 |
| Spanish American Indians | 0.0 /100 | #302 | Tragic $85,728 |
| Hispanics or Latinos | 0.0 /100 | #303 | Tragic $85,647 |
| Mexicans | 0.0 /100 | #304 | Tragic $85,618 |
| Paiute | 0.0 /100 | #305 | Tragic $85,414 |
| Immigrants | Dominica | 0.0 /100 | #306 | Tragic $85,411 |
| Chickasaw | 0.0 /100 | #307 | Tragic $85,356 |
| U.S. Virgin Islanders | 0.0 /100 | #308 | Tragic $85,294 |
| Haitians | 0.0 /100 | #309 | Tragic $85,218 |
| Immigrants | Central America | 0.0 /100 | #310 | Tragic $85,050 |