Immigrants from Denmark vs Turkish Householder Income Over 65 years
COMPARE
Immigrants from Denmark
Turkish
Householder Income Over 65 years
Householder Income Over 65 years Comparison
Immigrants from Denmark
Turks
$68,801
HOUSEHOLDER INCOME OVER 65 YEARS
100.0/ 100
METRIC RATING
33rd/ 347
METRIC RANK
$68,037
HOUSEHOLDER INCOME OVER 65 YEARS
99.9/ 100
METRIC RATING
37th/ 347
METRIC RANK
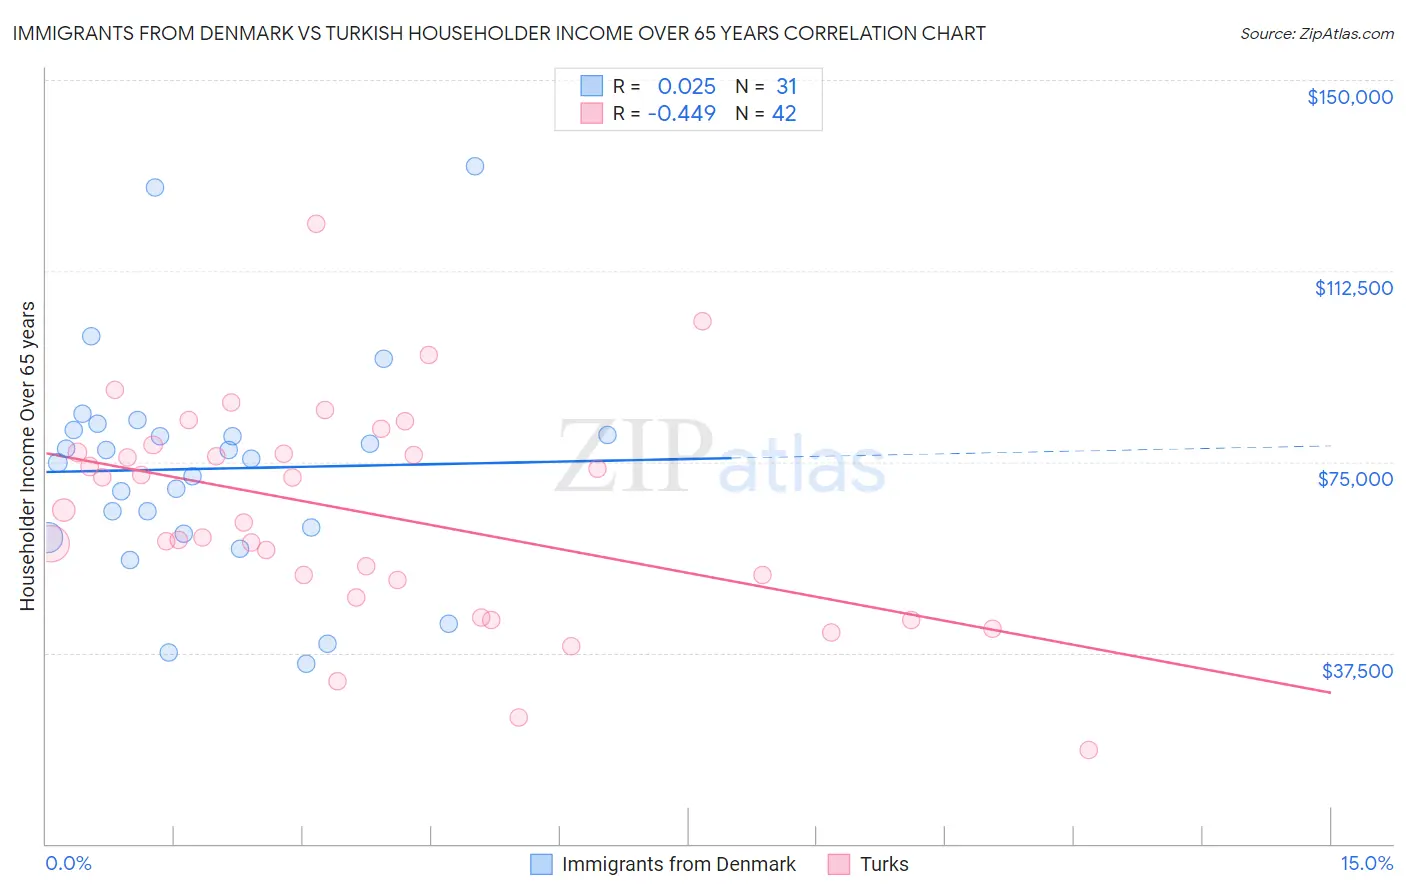
Immigrants from Denmark vs Turkish Householder Income Over 65 years Correlation Chart
The statistical analysis conducted on geographies consisting of 136,337,207 people shows no correlation between the proportion of Immigrants from Denmark and household income with householder over the age of 65 in the United States with a correlation coefficient (R) of 0.025 and weighted average of $68,801. Similarly, the statistical analysis conducted on geographies consisting of 271,295,449 people shows a moderate negative correlation between the proportion of Turks and household income with householder over the age of 65 in the United States with a correlation coefficient (R) of -0.449 and weighted average of $68,037, a difference of 1.1%.
Householder Income Over 65 years Correlation Summary
| Measurement | Immigrants from Denmark | Turkish |
| Minimum | $35,313 | $18,472 |
| Maximum | $133,125 | $121,806 |
| Range | $97,812 | $103,334 |
| Mean | $73,669 | $64,935 |
| Median | $75,568 | $64,229 |
| Interquartile 25% (IQ1) | $60,884 | $51,875 |
| Interquartile 75% (IQ3) | $81,334 | $76,840 |
| Interquartile Range (IQR) | $20,450 | $24,964 |
| Standard Deviation (Sample) | $21,898 | $21,025 |
| Standard Deviation (Population) | $21,542 | $20,773 |
Demographics Similar to Immigrants from Denmark and Turks by Householder Income Over 65 years
In terms of householder income over 65 years, the demographic groups most similar to Immigrants from Denmark are Asian ($68,822, a difference of 0.030%), Afghan ($68,951, a difference of 0.22%), Immigrants from Northern Europe ($69,003, a difference of 0.29%), Immigrants from Ireland ($68,495, a difference of 0.45%), and Immigrants from Australia ($69,164, a difference of 0.53%). Similarly, the demographic groups most similar to Turks are Estonian ($67,926, a difference of 0.16%), Immigrants from Austria ($68,208, a difference of 0.25%), Tongan ($68,235, a difference of 0.29%), Russian ($67,626, a difference of 0.61%), and Immigrants from Asia ($67,594, a difference of 0.66%).
| Demographics | Rating | Rank | Householder Income Over 65 years |
| Immigrants | Belgium | 100.0 /100 | #25 | Exceptional $69,703 |
| Immigrants | Sri Lanka | 100.0 /100 | #26 | Exceptional $69,426 |
| Immigrants | Switzerland | 100.0 /100 | #27 | Exceptional $69,343 |
| Immigrants | China | 100.0 /100 | #28 | Exceptional $69,174 |
| Immigrants | Australia | 100.0 /100 | #29 | Exceptional $69,164 |
| Immigrants | Northern Europe | 100.0 /100 | #30 | Exceptional $69,003 |
| Afghans | 100.0 /100 | #31 | Exceptional $68,951 |
| Asians | 100.0 /100 | #32 | Exceptional $68,822 |
| Immigrants | Denmark | 100.0 /100 | #33 | Exceptional $68,801 |
| Immigrants | Ireland | 100.0 /100 | #34 | Exceptional $68,495 |
| Tongans | 100.0 /100 | #35 | Exceptional $68,235 |
| Immigrants | Austria | 99.9 /100 | #36 | Exceptional $68,208 |
| Turks | 99.9 /100 | #37 | Exceptional $68,037 |
| Estonians | 99.9 /100 | #38 | Exceptional $67,926 |
| Russians | 99.9 /100 | #39 | Exceptional $67,626 |
| Immigrants | Asia | 99.9 /100 | #40 | Exceptional $67,594 |
| Koreans | 99.9 /100 | #41 | Exceptional $67,472 |
| New Zealanders | 99.9 /100 | #42 | Exceptional $67,333 |
| Latvians | 99.9 /100 | #43 | Exceptional $67,326 |
| Immigrants | South Africa | 99.9 /100 | #44 | Exceptional $67,234 |
| Immigrants | Afghanistan | 99.8 /100 | #45 | Exceptional $67,007 |