Immigrants from Czechoslovakia vs Immigrants Householder Income Over 65 years

COMPARE

Immigrants from Czechoslovakia
Race
Ancestry
AfghanAfricanAlaska NativeAlaskan AthabascanAlbanianAleutAlsatianAmericanApacheArabArapahoArgentineanArmenianAssyrian/Chaldean/SyriacAustralianAustrianBahamianBangladeshiBarbadianBasqueBelgianBelizeanBermudanBhutaneseBlackfeetBolivianBrazilianBritishBritish West IndianBulgarianBurmeseCajunCambodianCanadianCape VerdeanCarpatho RusynCelticCentral AmericanCentral American IndianCherokeeCheyenneChickasawChileanChineseChippewaChoctawColombianColvilleComancheCosta RicanCreeCreekCroatianCrowCubanCypriotCzechCzechoslovakianDanishDelawareDominicanDutchDutch West IndianEastern EuropeanEcuadorianEgyptianEnglishEstonianEthiopianEuropeanFijianFilipinoFinnishFrenchFrench American IndianFrench CanadianGermanGerman RussianGhanaianGreekGuamanian/ChamorroGuatemalanGuyaneseHaitianHmongHonduranHopiHoumaHungarianIcelanderIndian (Asian)IndonesianInupiatIranianIraqiIrishIroquoisIsraeliItalianJamaicanJapaneseJordanianKenyanKiowaKoreanLaotianLatvianLebaneseLiberianLithuanianLumbeeLuxembourgerMacedonianMalaysianMalteseMarshalleseMenomineeMexicanMexican American IndianMongolianMoroccanNative HawaiianNavajoNepaleseNew ZealanderNicaraguanNigerianNorthern EuropeanNorwegianOkinawanOsageOttawaPaiutePakistaniPalestinianPanamanianParaguayanPennsylvania GermanPeruvianPimaPolishPortuguesePotawatomiPuebloPuerto RicanPuget Sound SalishRomanianRussianSalvadoranSamoanScandinavianScotch-IrishScottishSeminoleSenegaleseSerbianShoshoneSierra LeoneanSiouxSlavicSlovakSloveneSomaliSouth AfricanSouth AmericanSouth American IndianSoviet UnionSpaniardSpanishSpanish AmericanSpanish American IndianSri LankanSubsaharan AfricanSudaneseSwedishSwissSyrianTaiwaneseThaiTlingit-HaidaTohono O'OdhamTonganTrinidadian and TobagonianTsimshianTurkishU.S. Virgin IslanderUgandanUkrainianUruguayanUteVenezuelanVietnameseWelshWest IndianYakamaYaquiYugoslavianYumanYup'ikZimbabwean
Immigration
NonimmigrantsAfghanistanAfricaAlbaniaArgentinaArmeniaAsiaAustraliaAustriaBahamasBangladeshBarbadosBelarusBelgiumBelizeBoliviaBosnia and HerzegovinaBrazilBulgariaBurma/MyanmarCabo VerdeCambodiaCameroonCanadaCaribbeanCentral AmericaChileChinaColombiaCongoCosta RicaCroatiaCubaCzechoslovakiaDenmarkDominicaDominican RepublicEastern AfricaEastern AsiaEastern EuropeEcuadorEgyptEl SalvadorEnglandEritreaEthiopiaEuropeFijiFranceGermanyGhanaGreeceGrenadaGuatemalaGuyanaHaitiHondurasHong KongHungaryIndiaIndonesiaIranIraqIrelandIsraelItalyJamaicaJapanJordanKazakhstanKenyaKoreaKuwaitLaosLatin AmericaLatviaLebanonLiberiaLithuaniaMalaysiaMexicoMicronesiaMiddle AfricaMoldovaMoroccoNepalNetherlandsNicaraguaNigeriaNorth AmericaNorth MacedoniaNorthern AfricaNorthern EuropeNorwayOceaniaPakistanPanamaPeruPhilippinesPolandPortugalRomaniaRussiaSaudi ArabiaScotlandSenegalSerbiaSierra LeoneSingaporeSomaliaSouth AfricaSouth AmericaSouth Central AsiaSouth Eastern AsiaSouthern EuropeSpainSri LankaSt. Vincent and the GrenadinesSudanSwedenSwitzerlandSyriaTaiwanThailandTrinidad and TobagoTurkeyUgandaUkraineUruguayUzbekistanVenezuelaVietnamWest IndiesWestern AfricaWestern AsiaWestern EuropeYemenZaireZimbabweAzores
Immigrants
Race
Ancestry
AfghanAfricanAlaska NativeAlaskan AthabascanAlbanianAleutAlsatianAmericanApacheArabArapahoArgentineanArmenianAssyrian/Chaldean/SyriacAustralianAustrianBahamianBangladeshiBarbadianBasqueBelgianBelizeanBermudanBhutaneseBlackfeetBolivianBrazilianBritishBritish West IndianBulgarianBurmeseCajunCambodianCanadianCape VerdeanCarpatho RusynCelticCentral AmericanCentral American IndianCherokeeCheyenneChickasawChileanChineseChippewaChoctawColombianColvilleComancheCosta RicanCreeCreekCroatianCrowCubanCypriotCzechCzechoslovakianDanishDelawareDominicanDutchDutch West IndianEastern EuropeanEcuadorianEgyptianEnglishEstonianEthiopianEuropeanFijianFilipinoFinnishFrenchFrench American IndianFrench CanadianGermanGerman RussianGhanaianGreekGuamanian/ChamorroGuatemalanGuyaneseHaitianHmongHonduranHopiHoumaHungarianIcelanderIndian (Asian)IndonesianInupiatIranianIraqiIrishIroquoisIsraeliItalianJamaicanJapaneseJordanianKenyanKiowaKoreanLaotianLatvianLebaneseLiberianLithuanianLumbeeLuxembourgerMacedonianMalaysianMalteseMarshalleseMenomineeMexicanMexican American IndianMongolianMoroccanNative HawaiianNavajoNepaleseNew ZealanderNicaraguanNigerianNorthern EuropeanNorwegianOkinawanOsageOttawaPaiutePakistaniPalestinianPanamanianParaguayanPennsylvania GermanPeruvianPimaPolishPortuguesePotawatomiPuebloPuerto RicanPuget Sound SalishRomanianRussianSalvadoranSamoanScandinavianScotch-IrishScottishSeminoleSenegaleseSerbianShoshoneSierra LeoneanSiouxSlavicSlovakSloveneSomaliSouth AfricanSouth AmericanSouth American IndianSoviet UnionSpaniardSpanishSpanish AmericanSpanish American IndianSri LankanSubsaharan AfricanSudaneseSwedishSwissSyrianTaiwaneseThaiTlingit-HaidaTohono O'OdhamTonganTrinidadian and TobagonianTsimshianTurkishU.S. Virgin IslanderUgandanUkrainianUruguayanUteVenezuelanVietnameseWelshWest IndianYakamaYaquiYugoslavianYumanYup'ikZimbabwean
Immigration
NonimmigrantsImmigrantsAfghanistanAfricaAlbaniaArgentinaArmeniaAsiaAustraliaAustriaBahamasBangladeshBarbadosBelarusBelgiumBelizeBoliviaBosnia and HerzegovinaBrazilBulgariaBurma/MyanmarCabo VerdeCambodiaCameroonCanadaCaribbeanCentral AmericaChileChinaColombiaCongoCosta RicaCroatiaCubaDenmarkDominicaDominican RepublicEastern AfricaEastern AsiaEastern EuropeEcuadorEgyptEl SalvadorEnglandEritreaEthiopiaEuropeFijiFranceGermanyGhanaGreeceGrenadaGuatemalaGuyanaHaitiHondurasHong KongHungaryIndiaIndonesiaIranIraqIrelandIsraelItalyJamaicaJapanJordanKazakhstanKenyaKoreaKuwaitLaosLatin AmericaLatviaLebanonLiberiaLithuaniaMalaysiaMexicoMicronesiaMiddle AfricaMoldovaMoroccoNepalNetherlandsNicaraguaNigeriaNorth AmericaNorth MacedoniaNorthern AfricaNorthern EuropeNorwayOceaniaPakistanPanamaPeruPhilippinesPolandPortugalRomaniaRussiaSaudi ArabiaScotlandSenegalSerbiaSierra LeoneSingaporeSomaliaSouth AfricaSouth AmericaSouth Central AsiaSouth Eastern AsiaSouthern EuropeSpainSri LankaSt. Vincent and the GrenadinesSudanSwedenSwitzerlandSyriaTaiwanThailandTrinidad and TobagoTurkeyUgandaUkraineUruguayUzbekistanVenezuelaVietnamWest IndiesWestern AfricaWestern AsiaWestern EuropeYemenZaireZimbabweAzores
Householder Income Over 65 years
Income
Poverty
Unemployment
Labor Participation
Family Structure
Vehicle Availability
Education Level
Disability

Householder Income Over 65 years Comparison

Immigrants from Czechoslovakia

Immigrants

Exceptional
Fair
$66,376
HOUSEHOLDER INCOME OVER 65 YEARS
99.7/ 100
METRIC RATING
55th/ 347
METRIC RANK
$59,656
HOUSEHOLDER INCOME OVER 65 YEARS
20.2/ 100
METRIC RATING
199th/ 347
METRIC RANK

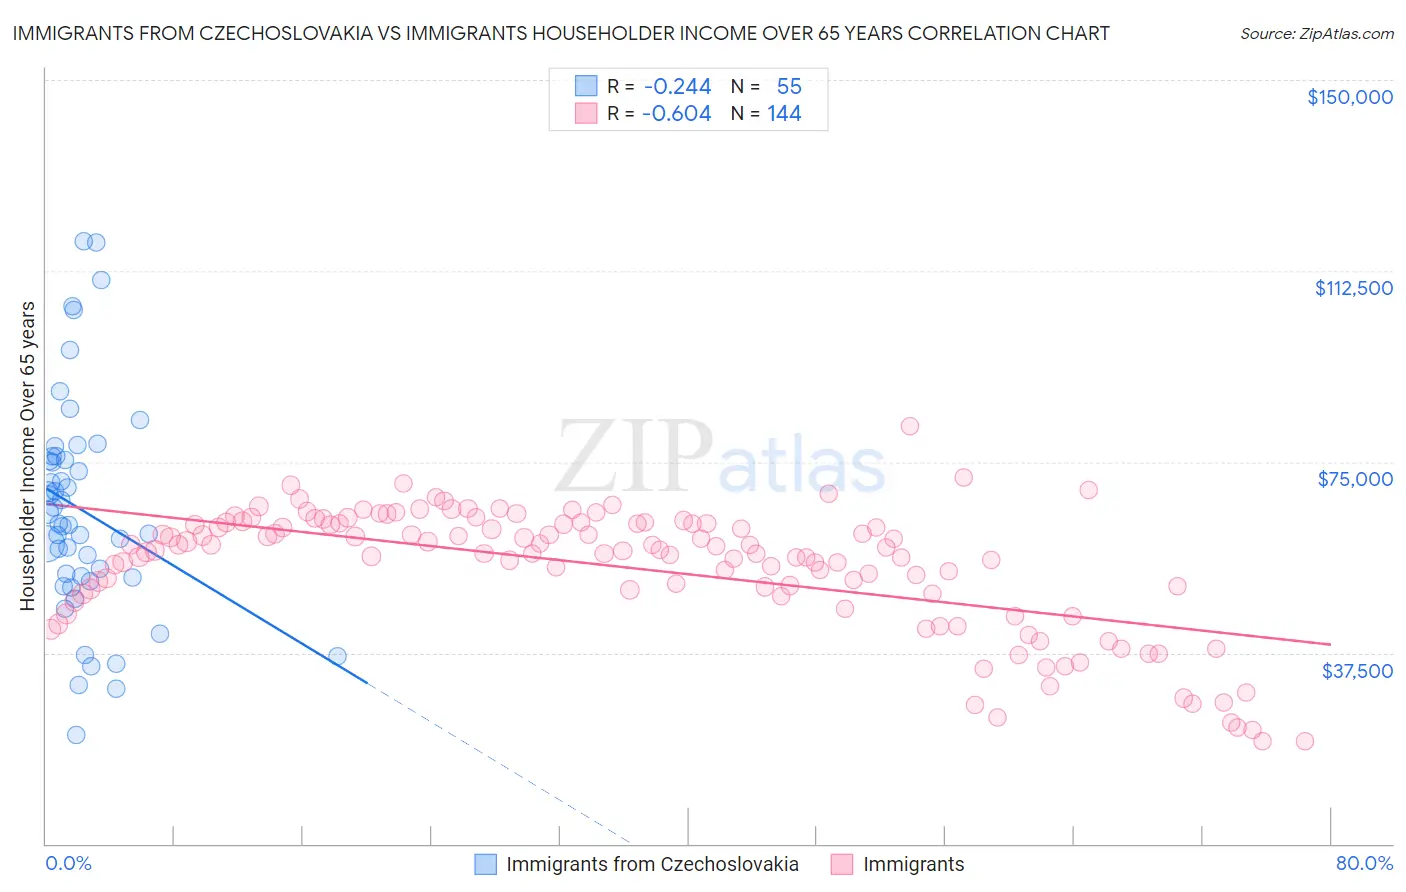
Immigrants from Czechoslovakia vs Immigrants Householder Income Over 65 years Correlation Chart

The statistical analysis conducted on geographies consisting of 195,347,436 people shows a weak negative correlation between the proportion of Immigrants from Czechoslovakia and household income with householder over the age of 65 in the United States with a correlation coefficient (R) of -0.244 and weighted average of $66,376. Similarly, the statistical analysis conducted on geographies consisting of 571,696,580 people shows a significant negative correlation between the proportion of Immigrants and household income with householder over the age of 65 in the United States with a correlation coefficient (R) of -0.604 and weighted average of $59,656, a difference of 11.3%.
Immigrants from Czechoslovakia vs Immigrants Householder Income Over 65 years

Householder Income Over 65 years Correlation Summary

MeasurementImmigrants from CzechoslovakiaImmigrants
Minimum$21,250$20,075
Maximum$118,263$81,974
Range$97,013$61,899
Mean$65,530$54,149
Median$62,798$57,563
Interquartile 25% (IQ1)$52,303$49,162
Interquartile 75% (IQ3)$76,120$62,877
Interquartile Range (IQR)$23,817$13,715
Standard Deviation (Sample)$21,477$12,348
Standard Deviation (Population)$21,281$12,305

Similar Demographics by Householder Income Over 65 years

Demographics Similar to Immigrants from Czechoslovakia by Householder Income Over 65 years

In terms of householder income over 65 years, the demographic groups most similar to Immigrants from Czechoslovakia are Laotian ($66,306, a difference of 0.11%), Immigrants from Netherlands ($66,463, a difference of 0.13%), Bulgarian ($66,236, a difference of 0.21%), Immigrants from Philippines ($66,161, a difference of 0.33%), and Immigrants from Pakistan ($66,617, a difference of 0.36%).
DemographicsRating | RankHouseholder Income Over 65 years
Immigrants | France
99.8
/100
|
#48
Exceptional
$66,826
Immigrants | Indonesia
99.8
/100
|
#49
Exceptional
$66,694
Immigrants | Turkey
99.7
/100
|
#50
Exceptional
$66,672
Israelis
99.7
/100
|
#51
Exceptional
$66,636
Immigrants | Scotland
99.7
/100
|
#52
Exceptional
$66,620
Immigrants | Pakistan
99.7
/100
|
#53
Exceptional
$66,617
Immigrants | Netherlands
99.7
/100
|
#54
Exceptional
$66,463
Immigrants | Czechoslovakia
99.7
/100
|
#55
Exceptional
$66,376
Laotians
99.6
/100
|
#56
Exceptional
$66,306
Bulgarians
99.6
/100
|
#57
Exceptional
$66,236
Immigrants | Philippines
99.6
/100
|
#58
Exceptional
$66,161
Immigrants | Norway
99.5
/100
|
#59
Exceptional
$66,118
Immigrants | Lithuania
99.5
/100
|
#60
Exceptional
$66,087
Maltese
99.5
/100
|
#61
Exceptional
$66,027
Immigrants | Sierra Leone
99.5
/100
|
#62
Exceptional
$66,009

Demographics Similar to Immigrants by Householder Income Over 65 years

In terms of householder income over 65 years, the demographic groups most similar to Immigrants are French ($59,656, a difference of 0.0%), Moroccan ($59,683, a difference of 0.050%), Immigrants from Kenya ($59,710, a difference of 0.090%), German ($59,730, a difference of 0.12%), and Dutch ($59,539, a difference of 0.20%).
DemographicsRating | RankHouseholder Income Over 65 years
South Americans
23.8
/100
|
#192
Fair
$59,854
Immigrants | Costa Rica
23.6
/100
|
#193
Fair
$59,848
Immigrants | Africa
23.4
/100
|
#194
Fair
$59,837
Immigrants | Iraq
23.2
/100
|
#195
Fair
$59,824
Germans
21.5
/100
|
#196
Fair
$59,730
Immigrants | Kenya
21.1
/100
|
#197
Fair
$59,710
Moroccans
20.7
/100
|
#198
Fair
$59,683
Immigrants | Immigrants
20.2
/100
|
#199
Fair
$59,656
French
20.2
/100
|
#200
Fair
$59,656
Dutch
18.3
/100
|
#201
Poor
$59,539
Finns
18.2
/100
|
#202
Poor
$59,535
Scotch-Irish
16.9
/100
|
#203
Poor
$59,447
Arapaho
16.0
/100
|
#204
Poor
$59,383
Immigrants | Sudan
14.2
/100
|
#205
Poor
$59,248
Immigrants | South America
13.0
/100
|
#206
Poor
$59,151