Immigrants from Costa Rica vs Immigrants from Ecuador Householder Income Under 25 years
COMPARE
Immigrants from Costa Rica
Immigrants from Ecuador
Householder Income Under 25 years
Householder Income Under 25 years Comparison
Immigrants from Costa Rica
Immigrants from Ecuador
$52,643
HOUSEHOLDER INCOME UNDER 25 YEARS
75.2/ 100
METRIC RATING
150th/ 347
METRIC RANK
$53,722
HOUSEHOLDER INCOME UNDER 25 YEARS
97.7/ 100
METRIC RATING
109th/ 347
METRIC RANK
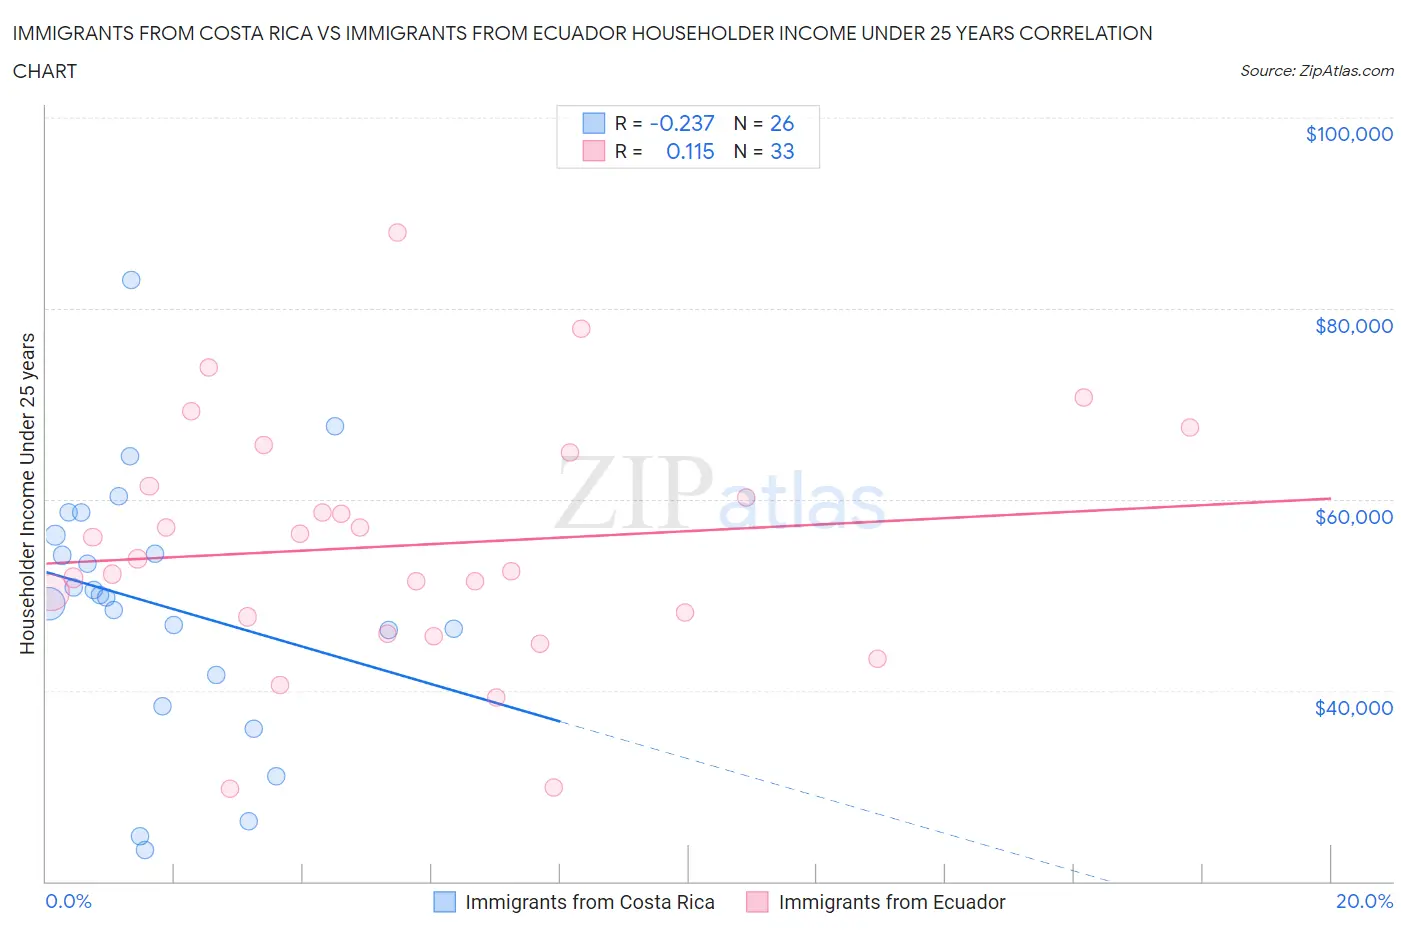
Immigrants from Costa Rica vs Immigrants from Ecuador Householder Income Under 25 years Correlation Chart
The statistical analysis conducted on geographies consisting of 182,309,221 people shows a weak negative correlation between the proportion of Immigrants from Costa Rica and household income with householder under the age of 25 in the United States with a correlation coefficient (R) of -0.237 and weighted average of $52,643. Similarly, the statistical analysis conducted on geographies consisting of 234,245,730 people shows a poor positive correlation between the proportion of Immigrants from Ecuador and household income with householder under the age of 25 in the United States with a correlation coefficient (R) of 0.115 and weighted average of $53,722, a difference of 2.1%.
Householder Income Under 25 years Correlation Summary
| Measurement | Immigrants from Costa Rica | Immigrants from Ecuador |
| Minimum | $23,333 | $29,733 |
| Maximum | $82,977 | $87,926 |
| Range | $59,644 | $58,193 |
| Mean | $48,845 | $55,187 |
| Median | $49,821 | $53,782 |
| Interquartile 25% (IQ1) | $41,645 | $46,779 |
| Interquartile 75% (IQ3) | $56,261 | $63,173 |
| Interquartile Range (IQR) | $14,616 | $16,394 |
| Standard Deviation (Sample) | $13,604 | $12,746 |
| Standard Deviation (Population) | $13,340 | $12,552 |
Similar Demographics by Householder Income Under 25 years
Demographics Similar to Immigrants from Costa Rica by Householder Income Under 25 years
In terms of householder income under 25 years, the demographic groups most similar to Immigrants from Costa Rica are Immigrants from Scotland ($52,638, a difference of 0.010%), Scandinavian ($52,654, a difference of 0.020%), Trinidadian and Tobagonian ($52,631, a difference of 0.020%), Central American ($52,626, a difference of 0.030%), and Immigrants from the Azores ($52,621, a difference of 0.040%).
| Demographics | Rating | Rank | Householder Income Under 25 years |
| Swedes | 87.5 /100 | #143 | Excellent $52,986 |
| South American Indians | 87.3 /100 | #144 | Excellent $52,979 |
| Immigrants | Western Europe | 86.7 /100 | #145 | Excellent $52,957 |
| Immigrants | Hungary | 81.6 /100 | #146 | Excellent $52,798 |
| Latvians | 81.0 /100 | #147 | Excellent $52,783 |
| French Canadians | 76.5 /100 | #148 | Good $52,672 |
| Scandinavians | 75.7 /100 | #149 | Good $52,654 |
| Immigrants | Costa Rica | 75.2 /100 | #150 | Good $52,643 |
| Immigrants | Scotland | 75.0 /100 | #151 | Good $52,638 |
| Trinidadians and Tobagonians | 74.6 /100 | #152 | Good $52,631 |
| Central Americans | 74.4 /100 | #153 | Good $52,626 |
| Immigrants | Azores | 74.2 /100 | #154 | Good $52,621 |
| Immigrants | Denmark | 73.8 /100 | #155 | Good $52,612 |
| Immigrants | Nepal | 73.7 /100 | #156 | Good $52,611 |
| Ghanaians | 72.9 /100 | #157 | Good $52,594 |
Demographics Similar to Immigrants from Ecuador by Householder Income Under 25 years
In terms of householder income under 25 years, the demographic groups most similar to Immigrants from Ecuador are Greek ($53,715, a difference of 0.010%), Immigrants from Colombia ($53,714, a difference of 0.010%), Maltese ($53,735, a difference of 0.020%), Australian ($53,739, a difference of 0.030%), and Immigrants from Oceania ($53,680, a difference of 0.080%).
| Demographics | Rating | Rank | Householder Income Under 25 years |
| Ecuadorians | 98.5 /100 | #102 | Exceptional $53,911 |
| Ukrainians | 98.3 /100 | #103 | Exceptional $53,843 |
| Ethiopians | 98.2 /100 | #104 | Exceptional $53,818 |
| Immigrants | France | 98.1 /100 | #105 | Exceptional $53,805 |
| Albanians | 98.1 /100 | #106 | Exceptional $53,794 |
| Australians | 97.8 /100 | #107 | Exceptional $53,739 |
| Maltese | 97.8 /100 | #108 | Exceptional $53,735 |
| Immigrants | Ecuador | 97.7 /100 | #109 | Exceptional $53,722 |
| Greeks | 97.7 /100 | #110 | Exceptional $53,715 |
| Immigrants | Colombia | 97.7 /100 | #111 | Exceptional $53,714 |
| Immigrants | Oceania | 97.5 /100 | #112 | Exceptional $53,680 |
| Romanians | 97.2 /100 | #113 | Exceptional $53,632 |
| Immigrants | Sweden | 97.1 /100 | #114 | Exceptional $53,621 |
| Immigrants | Albania | 96.9 /100 | #115 | Exceptional $53,597 |
| Immigrants | Spain | 96.6 /100 | #116 | Exceptional $53,560 |