Immigrants from Colombia vs Spanish Median Household Income
COMPARE
Immigrants from Colombia
Spanish
Median Household Income
Median Household Income Comparison
Immigrants from Colombia
Spanish
$83,902
MEDIAN HOUSEHOLD INCOME
31.7/ 100
METRIC RATING
189th/ 347
METRIC RANK
$83,343
MEDIAN HOUSEHOLD INCOME
24.4/ 100
METRIC RATING
201st/ 347
METRIC RANK
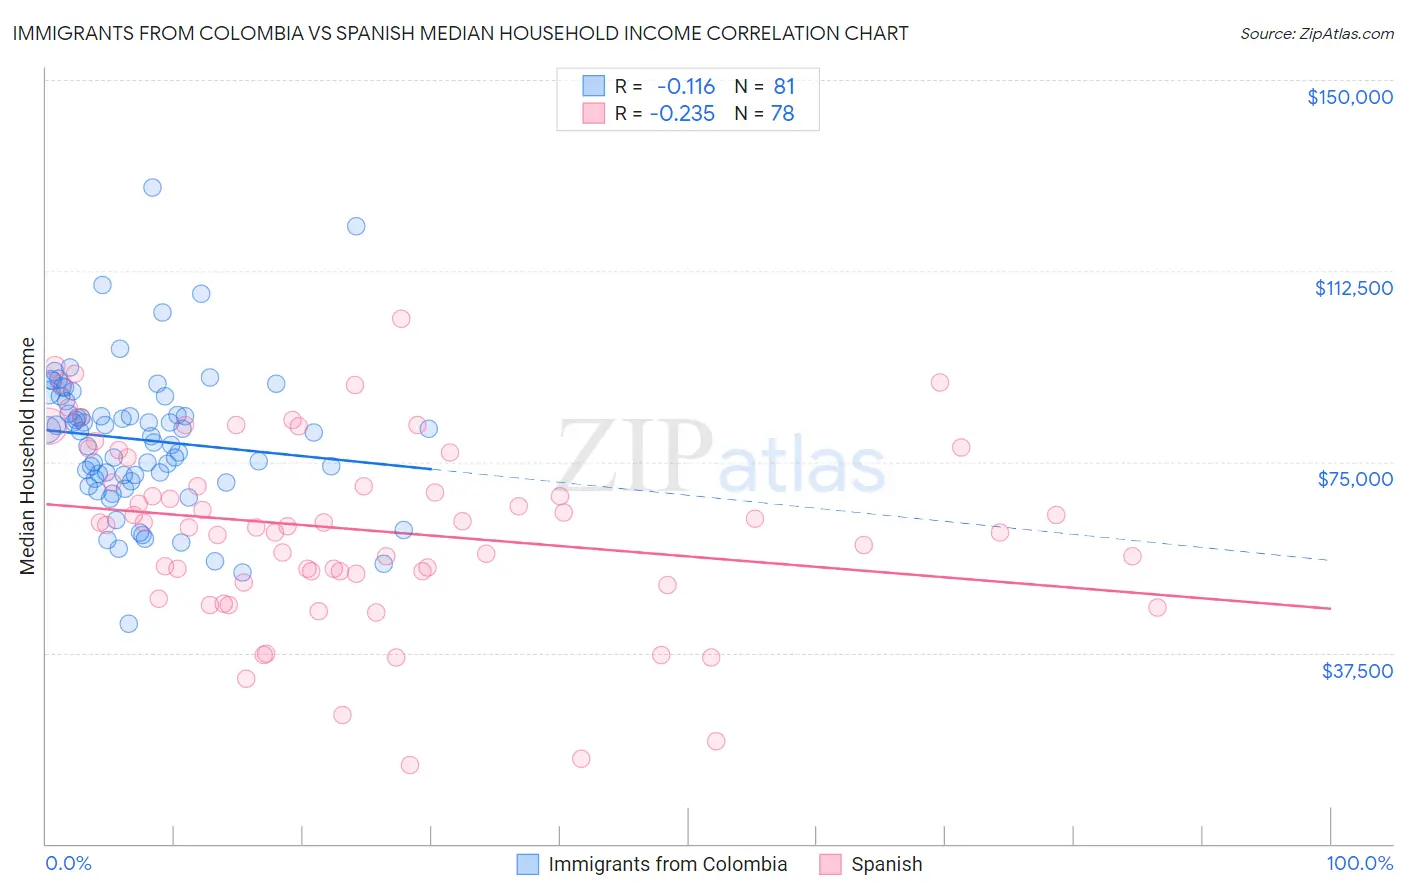
Immigrants from Colombia vs Spanish Median Household Income Correlation Chart
The statistical analysis conducted on geographies consisting of 378,453,155 people shows a poor negative correlation between the proportion of Immigrants from Colombia and median household income in the United States with a correlation coefficient (R) of -0.116 and weighted average of $83,902. Similarly, the statistical analysis conducted on geographies consisting of 421,807,066 people shows a weak negative correlation between the proportion of Spanish and median household income in the United States with a correlation coefficient (R) of -0.235 and weighted average of $83,343, a difference of 0.67%.
Median Household Income Correlation Summary
| Measurement | Immigrants from Colombia | Spanish |
| Minimum | $43,124 | $15,577 |
| Maximum | $128,990 | $103,194 |
| Range | $85,865 | $87,617 |
| Mean | $79,298 | $61,640 |
| Median | $80,865 | $62,411 |
| Interquartile 25% (IQ1) | $71,504 | $53,047 |
| Interquartile 75% (IQ3) | $87,336 | $75,942 |
| Interquartile Range (IQR) | $15,833 | $22,895 |
| Standard Deviation (Sample) | $14,245 | $18,137 |
| Standard Deviation (Population) | $14,157 | $18,021 |
Demographics Similar to Immigrants from Colombia and Spanish by Median Household Income
In terms of median household income, the demographic groups most similar to Immigrants from Colombia are Tlingit-Haida ($83,968, a difference of 0.080%), Slovak ($83,798, a difference of 0.12%), Puget Sound Salish ($84,011, a difference of 0.13%), Belgian ($84,008, a difference of 0.13%), and Iraqi ($83,753, a difference of 0.18%). Similarly, the demographic groups most similar to Spanish are Tsimshian ($83,346, a difference of 0.0%), German ($83,358, a difference of 0.020%), Immigrants from Thailand ($83,327, a difference of 0.020%), Immigrants from Cambodia ($83,304, a difference of 0.050%), and Japanese ($83,395, a difference of 0.060%).
| Demographics | Rating | Rank | Median Household Income |
| Kenyans | 34.2 /100 | #185 | Fair $84,085 |
| Puget Sound Salish | 33.2 /100 | #186 | Fair $84,011 |
| Belgians | 33.2 /100 | #187 | Fair $84,008 |
| Tlingit-Haida | 32.6 /100 | #188 | Fair $83,968 |
| Immigrants | Colombia | 31.7 /100 | #189 | Fair $83,902 |
| Slovaks | 30.2 /100 | #190 | Fair $83,798 |
| Iraqis | 29.6 /100 | #191 | Fair $83,753 |
| Welsh | 28.0 /100 | #192 | Fair $83,628 |
| Finns | 27.7 /100 | #193 | Fair $83,607 |
| Ghanaians | 27.4 /100 | #194 | Fair $83,582 |
| Immigrants | Armenia | 27.0 /100 | #195 | Fair $83,555 |
| French | 26.0 /100 | #196 | Fair $83,468 |
| Aleuts | 25.7 /100 | #197 | Fair $83,446 |
| Japanese | 25.1 /100 | #198 | Fair $83,395 |
| Germans | 24.6 /100 | #199 | Fair $83,358 |
| Tsimshian | 24.5 /100 | #200 | Fair $83,346 |
| Spanish | 24.4 /100 | #201 | Fair $83,343 |
| Immigrants | Thailand | 24.3 /100 | #202 | Fair $83,327 |
| Immigrants | Cambodia | 24.0 /100 | #203 | Fair $83,304 |
| Immigrants | Africa | 23.8 /100 | #204 | Fair $83,289 |
| Celtics | 22.7 /100 | #205 | Fair $83,193 |