Immigrants from China vs Assyrian/Chaldean/Syriac Householder Income Under 25 years
COMPARE
Immigrants from China
Assyrian/Chaldean/Syriac
Householder Income Under 25 years
Householder Income Under 25 years Comparison
Immigrants from China
Assyrians/Chaldeans/Syriacs
$57,931
HOUSEHOLDER INCOME UNDER 25 YEARS
100.0/ 100
METRIC RATING
11th/ 347
METRIC RANK
$65,329
HOUSEHOLDER INCOME UNDER 25 YEARS
100.0/ 100
METRIC RATING
1st/ 347
METRIC RANK
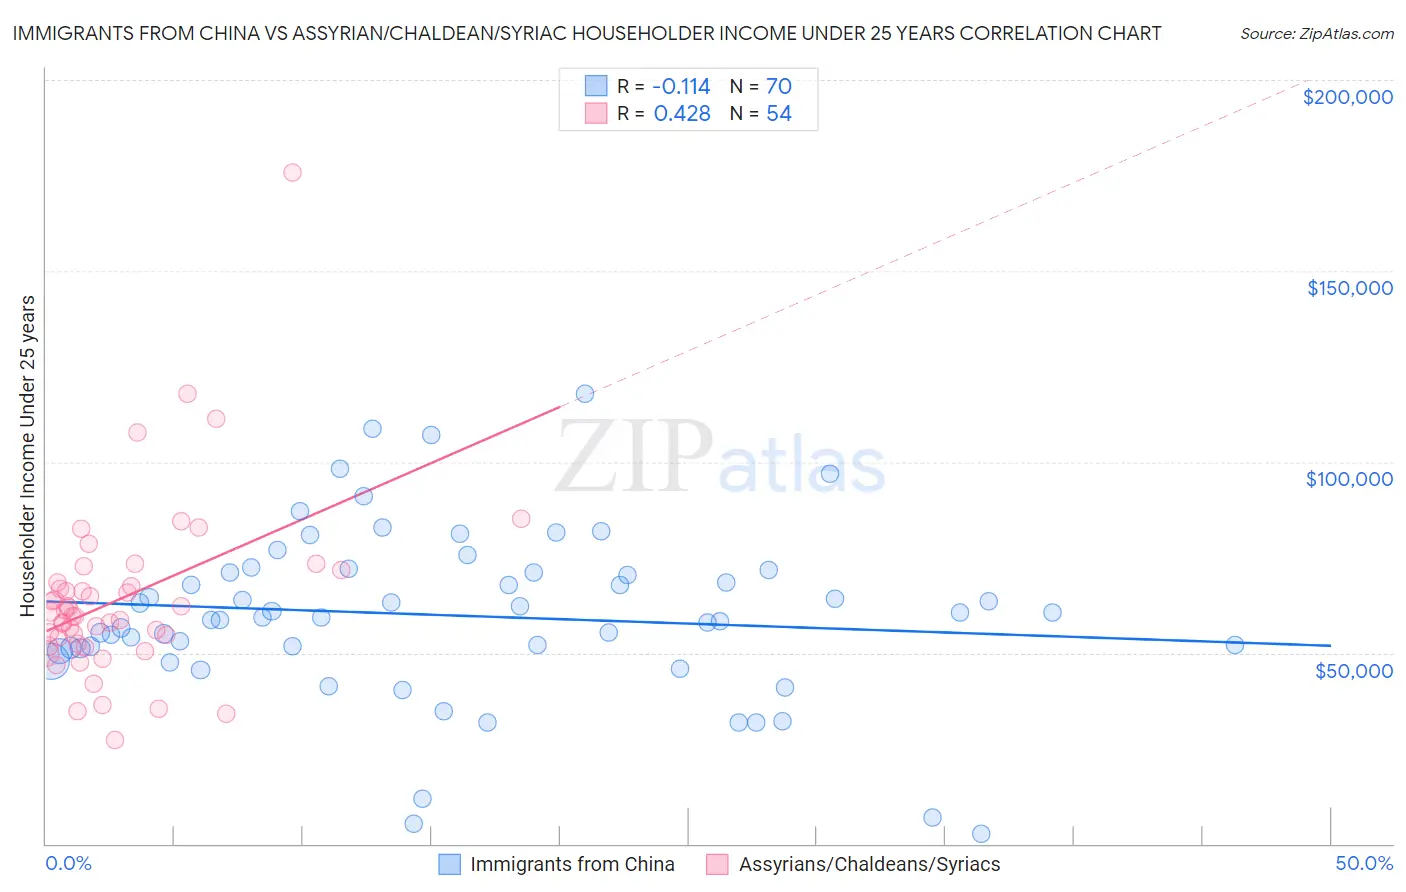
Immigrants from China vs Assyrian/Chaldean/Syriac Householder Income Under 25 years Correlation Chart
The statistical analysis conducted on geographies consisting of 376,634,050 people shows a poor negative correlation between the proportion of Immigrants from China and household income with householder under the age of 25 in the United States with a correlation coefficient (R) of -0.114 and weighted average of $57,931. Similarly, the statistical analysis conducted on geographies consisting of 100,770,753 people shows a moderate positive correlation between the proportion of Assyrians/Chaldeans/Syriacs and household income with householder under the age of 25 in the United States with a correlation coefficient (R) of 0.428 and weighted average of $65,329, a difference of 12.8%.
Householder Income Under 25 years Correlation Summary
| Measurement | Immigrants from China | Assyrian/Chaldean/Syriac |
| Minimum | $2,499 | $27,045 |
| Maximum | $117,772 | $175,865 |
| Range | $115,273 | $148,820 |
| Mean | $59,820 | $64,201 |
| Median | $59,134 | $60,126 |
| Interquartile 25% (IQ1) | $51,147 | $52,453 |
| Interquartile 75% (IQ3) | $71,074 | $68,319 |
| Interquartile Range (IQR) | $19,928 | $15,866 |
| Standard Deviation (Sample) | $22,263 | $23,487 |
| Standard Deviation (Population) | $22,103 | $23,269 |
Demographics Similar to Immigrants from China and Assyrians/Chaldeans/Syriacs by Householder Income Under 25 years
In terms of householder income under 25 years, the demographic groups most similar to Immigrants from China are Immigrants from Philippines ($57,930, a difference of 0.0%), Afghan ($58,019, a difference of 0.15%), Immigrants from South Central Asia ($57,818, a difference of 0.20%), Filipino ($57,740, a difference of 0.33%), and Korean ($57,730, a difference of 0.35%). Similarly, the demographic groups most similar to Assyrians/Chaldeans/Syriacs are Immigrants from Hong Kong ($62,083, a difference of 5.2%), Immigrants from India ($59,914, a difference of 9.0%), Immigrants from Taiwan ($59,424, a difference of 9.9%), Immigrants from Bolivia ($59,389, a difference of 10.0%), and Thai ($59,187, a difference of 10.4%).
| Demographics | Rating | Rank | Householder Income Under 25 years |
| Assyrians/Chaldeans/Syriacs | 100.0 /100 | #1 | Exceptional $65,329 |
| Immigrants | Hong Kong | 100.0 /100 | #2 | Exceptional $62,083 |
| Immigrants | India | 100.0 /100 | #3 | Exceptional $59,914 |
| Immigrants | Taiwan | 100.0 /100 | #4 | Exceptional $59,424 |
| Immigrants | Bolivia | 100.0 /100 | #5 | Exceptional $59,389 |
| Thais | 100.0 /100 | #6 | Exceptional $59,187 |
| Bolivians | 100.0 /100 | #7 | Exceptional $58,506 |
| Indians (Asian) | 100.0 /100 | #8 | Exceptional $58,239 |
| Chinese | 100.0 /100 | #9 | Exceptional $58,162 |
| Afghans | 100.0 /100 | #10 | Exceptional $58,019 |
| Immigrants | China | 100.0 /100 | #11 | Exceptional $57,931 |
| Immigrants | Philippines | 100.0 /100 | #12 | Exceptional $57,930 |
| Immigrants | South Central Asia | 100.0 /100 | #13 | Exceptional $57,818 |
| Filipinos | 100.0 /100 | #14 | Exceptional $57,740 |
| Koreans | 100.0 /100 | #15 | Exceptional $57,730 |
| Immigrants | Afghanistan | 100.0 /100 | #16 | Exceptional $57,478 |
| Sierra Leoneans | 100.0 /100 | #17 | Exceptional $57,272 |
| Immigrants | Eastern Asia | 100.0 /100 | #18 | Exceptional $57,123 |
| Bhutanese | 100.0 /100 | #19 | Exceptional $57,078 |
| Immigrants | Ireland | 100.0 /100 | #20 | Exceptional $57,075 |