Immigrants from Chile vs Mexican Median Earnings
COMPARE
Immigrants from Chile
Mexican
Median Earnings
Median Earnings Comparison
Immigrants from Chile
Mexicans
$47,697
MEDIAN EARNINGS
85.5/ 100
METRIC RATING
146th/ 347
METRIC RANK
$39,834
MEDIAN EARNINGS
0.0/ 100
METRIC RATING
321st/ 347
METRIC RANK
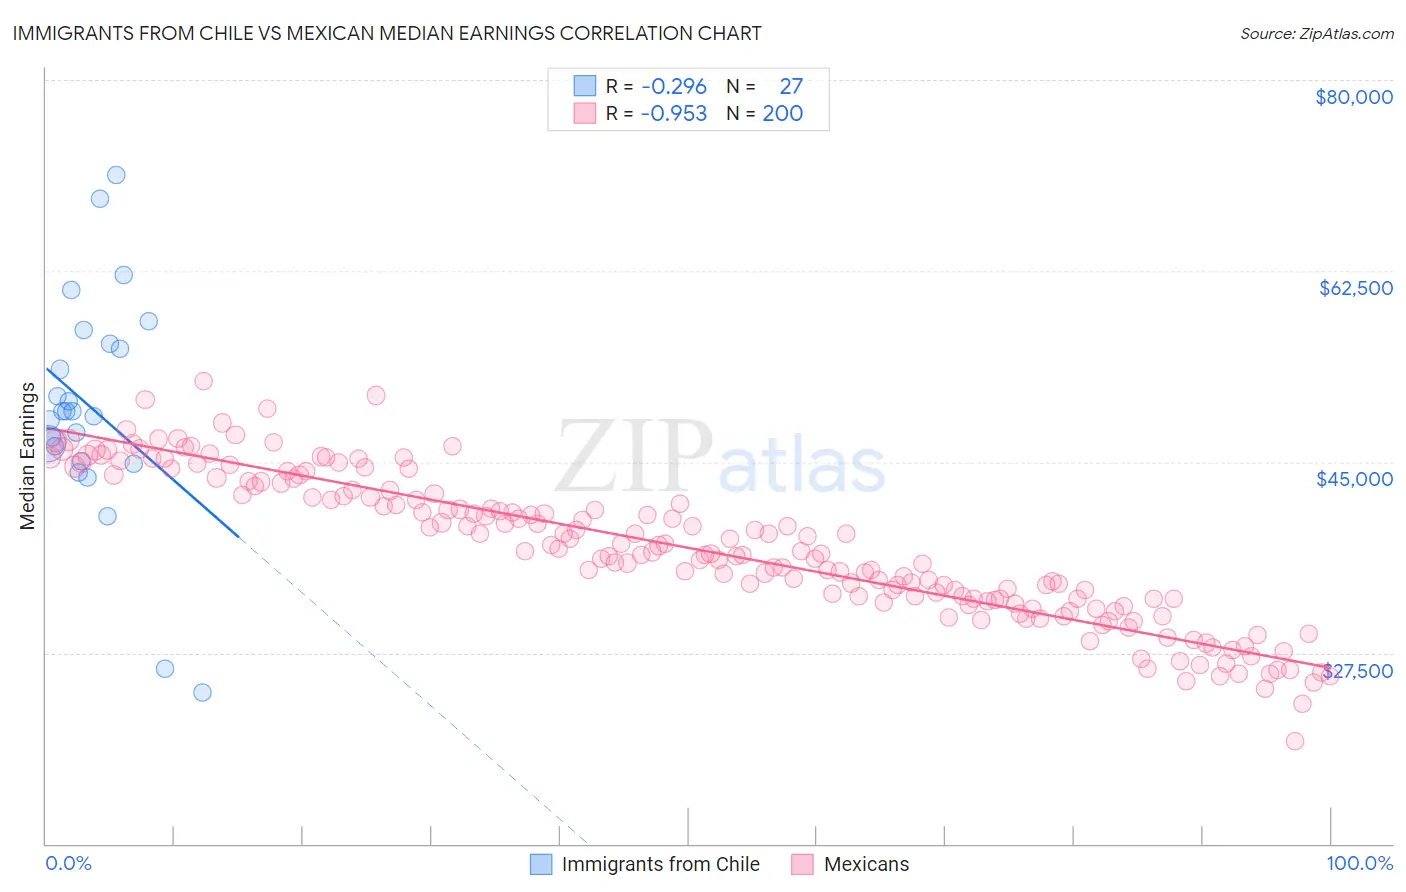
Immigrants from Chile vs Mexican Median Earnings Correlation Chart
The statistical analysis conducted on geographies consisting of 218,645,469 people shows a weak negative correlation between the proportion of Immigrants from Chile and median earnings in the United States with a correlation coefficient (R) of -0.296 and weighted average of $47,697. Similarly, the statistical analysis conducted on geographies consisting of 564,951,151 people shows a perfect negative correlation between the proportion of Mexicans and median earnings in the United States with a correlation coefficient (R) of -0.953 and weighted average of $39,834, a difference of 19.7%.
Median Earnings Correlation Summary
| Measurement | Immigrants from Chile | Mexican |
| Minimum | $23,911 | $19,356 |
| Maximum | $71,250 | $52,379 |
| Range | $47,339 | $33,023 |
| Mean | $49,886 | $37,116 |
| Median | $49,642 | $36,764 |
| Interquartile 25% (IQ1) | $45,024 | $32,451 |
| Interquartile 75% (IQ3) | $55,791 | $42,421 |
| Interquartile Range (IQR) | $10,767 | $9,971 |
| Standard Deviation (Sample) | $10,356 | $6,683 |
| Standard Deviation (Population) | $10,162 | $6,666 |
Similar Demographics by Median Earnings
Demographics Similar to Immigrants from Chile by Median Earnings
In terms of median earnings, the demographic groups most similar to Immigrants from Chile are Immigrants from Saudi Arabia ($47,704, a difference of 0.010%), Immigrants from South Eastern Asia ($47,671, a difference of 0.060%), Immigrants from Eritrea ($47,657, a difference of 0.080%), Luxembourger ($47,640, a difference of 0.12%), and Peruvian ($47,628, a difference of 0.15%).
| Demographics | Rating | Rank | Median Earnings |
| Canadians | 88.8 /100 | #139 | Excellent $47,911 |
| Taiwanese | 88.7 /100 | #140 | Excellent $47,902 |
| Immigrants | Sierra Leone | 88.3 /100 | #141 | Excellent $47,875 |
| Ugandans | 88.0 /100 | #142 | Excellent $47,854 |
| Swedes | 88.0 /100 | #143 | Excellent $47,851 |
| Hungarians | 87.1 /100 | #144 | Excellent $47,795 |
| Immigrants | Saudi Arabia | 85.6 /100 | #145 | Excellent $47,704 |
| Immigrants | Chile | 85.5 /100 | #146 | Excellent $47,697 |
| Immigrants | South Eastern Asia | 85.0 /100 | #147 | Excellent $47,671 |
| Immigrants | Eritrea | 84.8 /100 | #148 | Excellent $47,657 |
| Luxembourgers | 84.5 /100 | #149 | Excellent $47,640 |
| Peruvians | 84.2 /100 | #150 | Excellent $47,628 |
| Immigrants | Oceania | 84.1 /100 | #151 | Excellent $47,617 |
| Immigrants | Germany | 83.1 /100 | #152 | Excellent $47,566 |
| Slavs | 81.1 /100 | #153 | Excellent $47,470 |
Demographics Similar to Mexicans by Median Earnings
In terms of median earnings, the demographic groups most similar to Mexicans are Immigrants from Bahamas ($39,861, a difference of 0.070%), Immigrants from Central America ($39,762, a difference of 0.18%), Bahamian ($39,735, a difference of 0.25%), Ottawa ($39,721, a difference of 0.29%), and Creek ($39,648, a difference of 0.47%).
| Demographics | Rating | Rank | Median Earnings |
| Cheyenne | 0.0 /100 | #314 | Tragic $40,233 |
| Seminole | 0.0 /100 | #315 | Tragic $40,233 |
| Immigrants | Honduras | 0.0 /100 | #316 | Tragic $40,195 |
| Fijians | 0.0 /100 | #317 | Tragic $40,193 |
| Dutch West Indians | 0.0 /100 | #318 | Tragic $40,107 |
| Blacks/African Americans | 0.0 /100 | #319 | Tragic $40,085 |
| Immigrants | Bahamas | 0.0 /100 | #320 | Tragic $39,861 |
| Mexicans | 0.0 /100 | #321 | Tragic $39,834 |
| Immigrants | Central America | 0.0 /100 | #322 | Tragic $39,762 |
| Bahamians | 0.0 /100 | #323 | Tragic $39,735 |
| Ottawa | 0.0 /100 | #324 | Tragic $39,721 |
| Creek | 0.0 /100 | #325 | Tragic $39,648 |
| Immigrants | Yemen | 0.0 /100 | #326 | Tragic $39,540 |
| Yuman | 0.0 /100 | #327 | Tragic $39,523 |
| Sioux | 0.0 /100 | #328 | Tragic $39,448 |