Immigrants from Chile vs Dutch West Indian Householder Income Ages 25 - 44 years
COMPARE
Immigrants from Chile
Dutch West Indian
Householder Income Ages 25 - 44 years
Householder Income Ages 25 - 44 years Comparison
Immigrants from Chile
Dutch West Indians
$97,159
HOUSEHOLDER INCOME AGES 25 - 44 YEARS
80.8/ 100
METRIC RATING
144th/ 347
METRIC RANK
$77,260
HOUSEHOLDER INCOME AGES 25 - 44 YEARS
0.0/ 100
METRIC RATING
324th/ 347
METRIC RANK
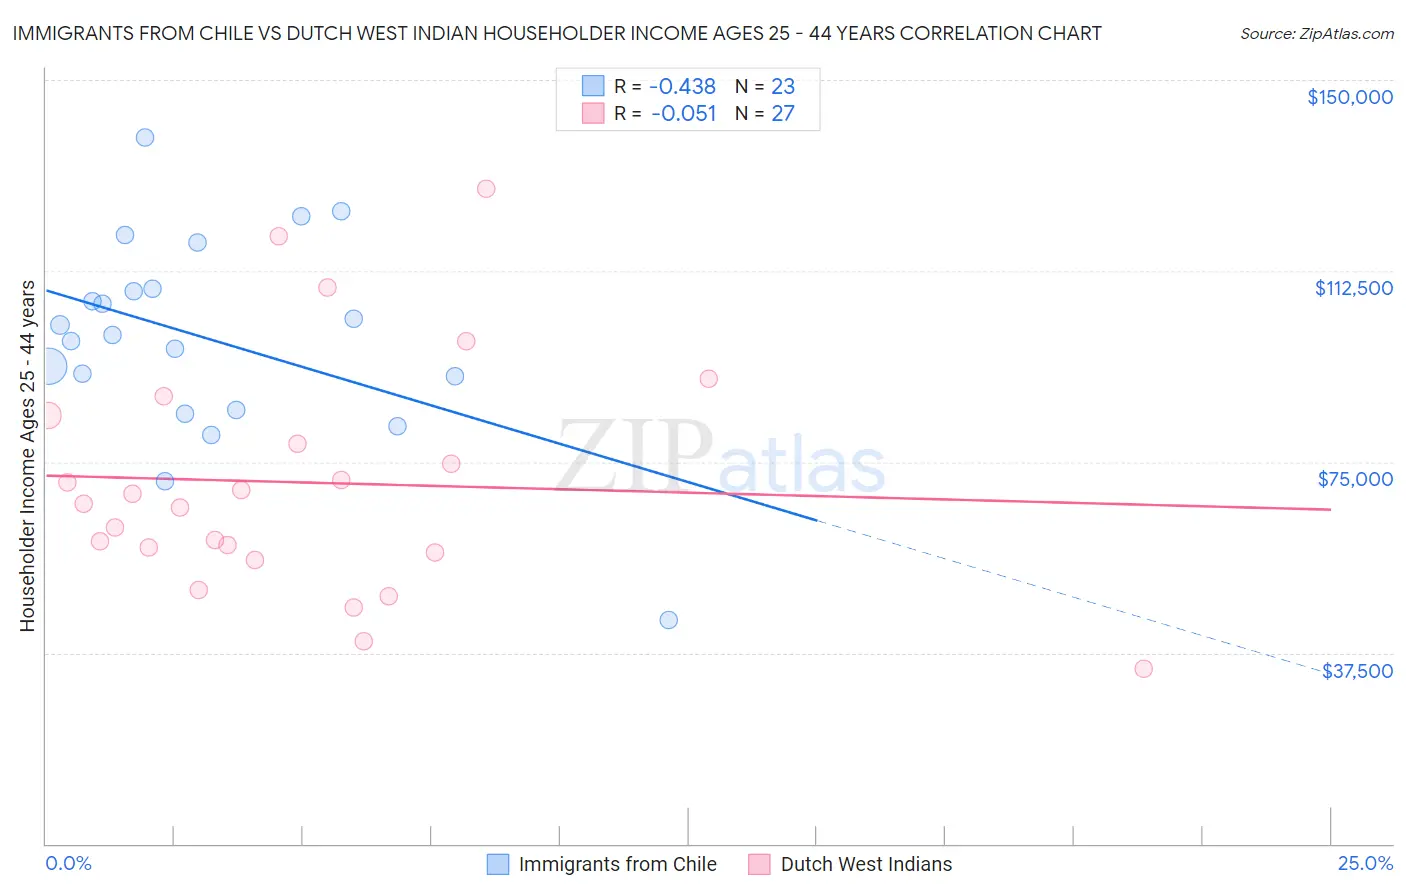
Immigrants from Chile vs Dutch West Indian Householder Income Ages 25 - 44 years Correlation Chart
The statistical analysis conducted on geographies consisting of 218,505,323 people shows a moderate negative correlation between the proportion of Immigrants from Chile and household income with householder between the ages 25 and 44 in the United States with a correlation coefficient (R) of -0.438 and weighted average of $97,159. Similarly, the statistical analysis conducted on geographies consisting of 85,685,681 people shows a slight negative correlation between the proportion of Dutch West Indians and household income with householder between the ages 25 and 44 in the United States with a correlation coefficient (R) of -0.051 and weighted average of $77,260, a difference of 25.8%.
Householder Income Ages 25 - 44 years Correlation Summary
| Measurement | Immigrants from Chile | Dutch West Indian |
| Minimum | $43,889 | $34,250 |
| Maximum | $138,706 | $128,750 |
| Range | $94,817 | $94,500 |
| Mean | $99,118 | $70,946 |
| Median | $99,927 | $66,805 |
| Interquartile 25% (IQ1) | $85,105 | $57,188 |
| Interquartile 75% (IQ3) | $109,064 | $84,121 |
| Interquartile Range (IQR) | $23,959 | $26,933 |
| Standard Deviation (Sample) | $20,106 | $23,101 |
| Standard Deviation (Population) | $19,664 | $22,670 |
Similar Demographics by Householder Income Ages 25 - 44 years
Demographics Similar to Immigrants from Chile by Householder Income Ages 25 - 44 years
In terms of householder income ages 25 - 44 years, the demographic groups most similar to Immigrants from Chile are Immigrants from Jordan ($97,185, a difference of 0.030%), Danish ($97,221, a difference of 0.060%), Luxembourger ($97,237, a difference of 0.080%), Immigrants from Morocco ($97,305, a difference of 0.15%), and Arab ($97,336, a difference of 0.18%).
| Demographics | Rating | Rank | Householder Income Ages 25 - 44 years |
| Lebanese | 82.3 /100 | #137 | Excellent $97,339 |
| Arabs | 82.3 /100 | #138 | Excellent $97,336 |
| Immigrants | Peru | 82.2 /100 | #139 | Excellent $97,329 |
| Immigrants | Morocco | 82.0 /100 | #140 | Excellent $97,305 |
| Luxembourgers | 81.5 /100 | #141 | Excellent $97,237 |
| Danes | 81.3 /100 | #142 | Excellent $97,221 |
| Immigrants | Jordan | 81.0 /100 | #143 | Excellent $97,185 |
| Immigrants | Chile | 80.8 /100 | #144 | Excellent $97,159 |
| Norwegians | 78.2 /100 | #145 | Good $96,866 |
| Ethiopians | 77.8 /100 | #146 | Good $96,824 |
| Immigrants | Syria | 77.4 /100 | #147 | Good $96,789 |
| Irish | 76.9 /100 | #148 | Good $96,730 |
| Basques | 76.6 /100 | #149 | Good $96,709 |
| Ugandans | 76.2 /100 | #150 | Good $96,667 |
| Czechs | 74.8 /100 | #151 | Good $96,525 |
Demographics Similar to Dutch West Indians by Householder Income Ages 25 - 44 years
In terms of householder income ages 25 - 44 years, the demographic groups most similar to Dutch West Indians are Immigrants from Honduras ($77,328, a difference of 0.090%), Sioux ($77,089, a difference of 0.22%), Houma ($77,044, a difference of 0.28%), Immigrants from Bahamas ($76,910, a difference of 0.46%), and Immigrants from Cuba ($76,701, a difference of 0.73%).
| Demographics | Rating | Rank | Householder Income Ages 25 - 44 years |
| U.S. Virgin Islanders | 0.0 /100 | #317 | Tragic $78,911 |
| Immigrants | Mexico | 0.0 /100 | #318 | Tragic $78,809 |
| Hondurans | 0.0 /100 | #319 | Tragic $78,540 |
| Choctaw | 0.0 /100 | #320 | Tragic $78,168 |
| Immigrants | Zaire | 0.0 /100 | #321 | Tragic $78,045 |
| Chickasaw | 0.0 /100 | #322 | Tragic $77,929 |
| Immigrants | Honduras | 0.0 /100 | #323 | Tragic $77,328 |
| Dutch West Indians | 0.0 /100 | #324 | Tragic $77,260 |
| Sioux | 0.0 /100 | #325 | Tragic $77,089 |
| Houma | 0.0 /100 | #326 | Tragic $77,044 |
| Immigrants | Bahamas | 0.0 /100 | #327 | Tragic $76,910 |
| Immigrants | Cuba | 0.0 /100 | #328 | Tragic $76,701 |
| Seminole | 0.0 /100 | #329 | Tragic $76,584 |
| Yakama | 0.0 /100 | #330 | Tragic $76,226 |
| Natives/Alaskans | 0.0 /100 | #331 | Tragic $75,647 |