Immigrants from Caribbean vs Dutch Householder Income Ages 25 - 44 years
COMPARE
Immigrants from Caribbean
Dutch
Householder Income Ages 25 - 44 years
Householder Income Ages 25 - 44 years Comparison
Immigrants from Caribbean
Dutch
$80,326
HOUSEHOLDER INCOME AGES 25 - 44 YEARS
0.0/ 100
METRIC RATING
304th/ 347
METRIC RANK
$93,081
HOUSEHOLDER INCOME AGES 25 - 44 YEARS
30.5/ 100
METRIC RATING
189th/ 347
METRIC RANK
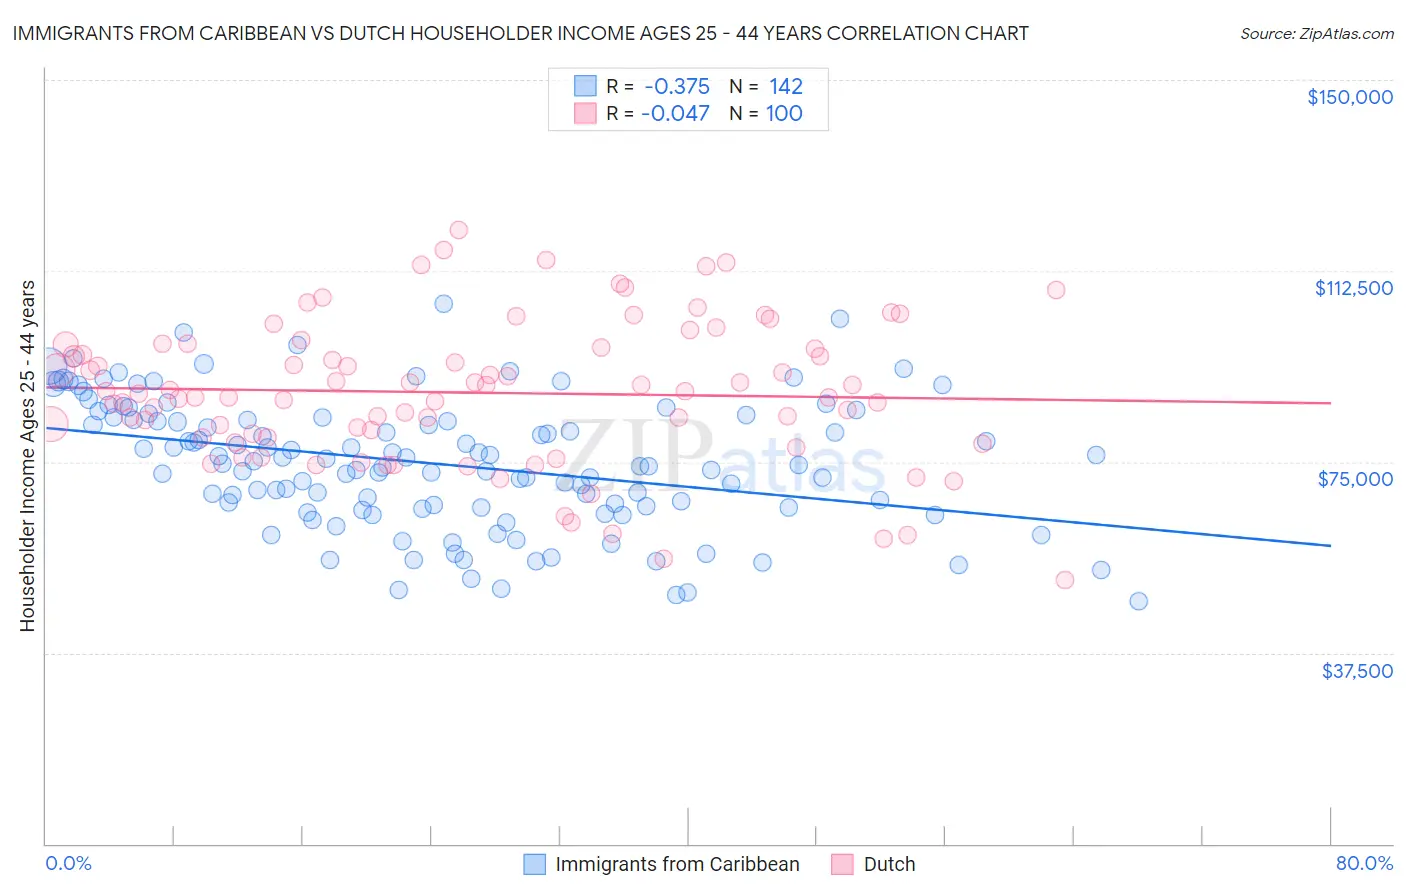
Immigrants from Caribbean vs Dutch Householder Income Ages 25 - 44 years Correlation Chart
The statistical analysis conducted on geographies consisting of 448,247,507 people shows a mild negative correlation between the proportion of Immigrants from Caribbean and household income with householder between the ages 25 and 44 in the United States with a correlation coefficient (R) of -0.375 and weighted average of $80,326. Similarly, the statistical analysis conducted on geographies consisting of 549,678,826 people shows no correlation between the proportion of Dutch and household income with householder between the ages 25 and 44 in the United States with a correlation coefficient (R) of -0.047 and weighted average of $93,081, a difference of 15.9%.
Householder Income Ages 25 - 44 years Correlation Summary
| Measurement | Immigrants from Caribbean | Dutch |
| Minimum | $47,510 | $51,827 |
| Maximum | $105,938 | $120,421 |
| Range | $58,428 | $68,594 |
| Mean | $74,665 | $88,577 |
| Median | $74,621 | $88,539 |
| Interquartile 25% (IQ1) | $66,150 | $79,727 |
| Interquartile 75% (IQ3) | $83,625 | $97,721 |
| Interquartile Range (IQR) | $17,475 | $17,995 |
| Standard Deviation (Sample) | $12,546 | $14,058 |
| Standard Deviation (Population) | $12,502 | $13,987 |
Similar Demographics by Householder Income Ages 25 - 44 years
Demographics Similar to Immigrants from Caribbean by Householder Income Ages 25 - 44 years
In terms of householder income ages 25 - 44 years, the demographic groups most similar to Immigrants from Caribbean are Immigrants from Dominican Republic ($80,319, a difference of 0.010%), Apache ($80,260, a difference of 0.080%), Mexican ($80,427, a difference of 0.13%), Hispanic or Latino ($80,515, a difference of 0.24%), and Immigrants from Micronesia ($80,544, a difference of 0.27%).
| Demographics | Rating | Rank | Householder Income Ages 25 - 44 years |
| Immigrants | Guatemala | 0.1 /100 | #297 | Tragic $81,341 |
| Dominicans | 0.1 /100 | #298 | Tragic $81,229 |
| Immigrants | Liberia | 0.1 /100 | #299 | Tragic $80,863 |
| Cherokee | 0.0 /100 | #300 | Tragic $80,843 |
| Immigrants | Micronesia | 0.0 /100 | #301 | Tragic $80,544 |
| Hispanics or Latinos | 0.0 /100 | #302 | Tragic $80,515 |
| Mexicans | 0.0 /100 | #303 | Tragic $80,427 |
| Immigrants | Caribbean | 0.0 /100 | #304 | Tragic $80,326 |
| Immigrants | Dominican Republic | 0.0 /100 | #305 | Tragic $80,319 |
| Apache | 0.0 /100 | #306 | Tragic $80,260 |
| Haitians | 0.0 /100 | #307 | Tragic $80,055 |
| Immigrants | Central America | 0.0 /100 | #308 | Tragic $80,012 |
| Chippewa | 0.0 /100 | #309 | Tragic $80,005 |
| Fijians | 0.0 /100 | #310 | Tragic $79,956 |
| Indonesians | 0.0 /100 | #311 | Tragic $79,543 |
Demographics Similar to Dutch by Householder Income Ages 25 - 44 years
In terms of householder income ages 25 - 44 years, the demographic groups most similar to Dutch are Immigrants from Sierra Leone ($93,115, a difference of 0.040%), Welsh ($93,039, a difference of 0.040%), Tlingit-Haida ($92,987, a difference of 0.10%), Immigrants from Costa Rica ($92,876, a difference of 0.22%), and Spaniard ($93,366, a difference of 0.31%).
| Demographics | Rating | Rank | Householder Income Ages 25 - 44 years |
| Uruguayans | 37.3 /100 | #182 | Fair $93,631 |
| Guamanians/Chamorros | 36.5 /100 | #183 | Fair $93,569 |
| Germans | 36.0 /100 | #184 | Fair $93,531 |
| Immigrants | Eritrea | 35.2 /100 | #185 | Fair $93,466 |
| Sierra Leoneans | 34.8 /100 | #186 | Fair $93,435 |
| Spaniards | 34.0 /100 | #187 | Fair $93,366 |
| Immigrants | Sierra Leone | 30.9 /100 | #188 | Fair $93,115 |
| Dutch | 30.5 /100 | #189 | Fair $93,081 |
| Welsh | 30.0 /100 | #190 | Fair $93,039 |
| Tlingit-Haida | 29.4 /100 | #191 | Fair $92,987 |
| Immigrants | Costa Rica | 28.2 /100 | #192 | Fair $92,876 |
| Samoans | 23.0 /100 | #193 | Fair $92,385 |
| Immigrants | Azores | 22.4 /100 | #194 | Fair $92,322 |
| Celtics | 21.6 /100 | #195 | Fair $92,241 |
| Immigrants | Colombia | 21.3 /100 | #196 | Fair $92,204 |