Immigrants from Cabo Verde vs Tongan Householder Income Over 65 years

COMPARE

Immigrants from Cabo Verde
Race
Ancestry
AfghanAfricanAlaska NativeAlaskan AthabascanAlbanianAleutAlsatianAmericanApacheArabArapahoArgentineanArmenianAssyrian/Chaldean/SyriacAustralianAustrianBahamianBangladeshiBarbadianBasqueBelgianBelizeanBermudanBhutaneseBlackfeetBolivianBrazilianBritishBritish West IndianBulgarianBurmeseCajunCambodianCanadianCape VerdeanCarpatho RusynCelticCentral AmericanCentral American IndianCherokeeCheyenneChickasawChileanChineseChippewaChoctawColombianColvilleComancheCosta RicanCreeCreekCroatianCrowCubanCypriotCzechCzechoslovakianDanishDelawareDominicanDutchDutch West IndianEastern EuropeanEcuadorianEgyptianEnglishEstonianEthiopianEuropeanFijianFilipinoFinnishFrenchFrench American IndianFrench CanadianGermanGerman RussianGhanaianGreekGuamanian/ChamorroGuatemalanGuyaneseHaitianHmongHonduranHopiHoumaHungarianIcelanderIndian (Asian)IndonesianInupiatIranianIraqiIrishIroquoisIsraeliItalianJamaicanJapaneseJordanianKenyanKiowaKoreanLaotianLatvianLebaneseLiberianLithuanianLumbeeLuxembourgerMacedonianMalaysianMalteseMarshalleseMenomineeMexicanMexican American IndianMongolianMoroccanNative HawaiianNavajoNepaleseNew ZealanderNicaraguanNigerianNorthern EuropeanNorwegianOkinawanOsageOttawaPaiutePakistaniPalestinianPanamanianParaguayanPennsylvania GermanPeruvianPimaPolishPortuguesePotawatomiPuebloPuerto RicanPuget Sound SalishRomanianRussianSalvadoranSamoanScandinavianScotch-IrishScottishSeminoleSenegaleseSerbianShoshoneSierra LeoneanSiouxSlavicSlovakSloveneSomaliSouth AfricanSouth AmericanSouth American IndianSoviet UnionSpaniardSpanishSpanish AmericanSpanish American IndianSri LankanSubsaharan AfricanSudaneseSwedishSwissSyrianTaiwaneseThaiTlingit-HaidaTohono O'OdhamTrinidadian and TobagonianTsimshianTurkishU.S. Virgin IslanderUgandanUkrainianUruguayanUteVenezuelanVietnameseWelshWest IndianYakamaYaquiYugoslavianYumanYup'ikZimbabwean
Immigration
NonimmigrantsImmigrantsAfghanistanAfricaAlbaniaArgentinaArmeniaAsiaAustraliaAustriaBahamasBangladeshBarbadosBelarusBelgiumBelizeBoliviaBosnia and HerzegovinaBrazilBulgariaBurma/MyanmarCabo VerdeCambodiaCameroonCanadaCaribbeanCentral AmericaChileChinaColombiaCongoCosta RicaCroatiaCubaCzechoslovakiaDenmarkDominicaDominican RepublicEastern AfricaEastern AsiaEastern EuropeEcuadorEgyptEl SalvadorEnglandEritreaEthiopiaEuropeFijiFranceGermanyGhanaGreeceGrenadaGuatemalaGuyanaHaitiHondurasHong KongHungaryIndiaIndonesiaIranIraqIrelandIsraelItalyJamaicaJapanJordanKazakhstanKenyaKoreaKuwaitLaosLatin AmericaLatviaLebanonLiberiaLithuaniaMalaysiaMexicoMicronesiaMiddle AfricaMoldovaMoroccoNepalNetherlandsNicaraguaNigeriaNorth AmericaNorth MacedoniaNorthern AfricaNorthern EuropeNorwayOceaniaPakistanPanamaPeruPhilippinesPolandPortugalRomaniaRussiaSaudi ArabiaScotlandSenegalSerbiaSierra LeoneSingaporeSomaliaSouth AfricaSouth AmericaSouth Central AsiaSouth Eastern AsiaSouthern EuropeSpainSri LankaSt. Vincent and the GrenadinesSudanSwedenSwitzerlandSyriaTaiwanThailandTrinidad and TobagoTurkeyUgandaUkraineUruguayUzbekistanVenezuelaVietnamWest IndiesWestern AfricaWestern AsiaWestern EuropeYemenZaireZimbabweAzores
Tongan
Race
Ancestry
AfghanAfricanAlaska NativeAlaskan AthabascanAlbanianAleutAlsatianAmericanApacheArabArapahoArgentineanArmenianAssyrian/Chaldean/SyriacAustralianAustrianBahamianBangladeshiBarbadianBasqueBelgianBelizeanBermudanBhutaneseBlackfeetBolivianBrazilianBritishBritish West IndianBulgarianBurmeseCajunCambodianCanadianCape VerdeanCarpatho RusynCelticCentral AmericanCentral American IndianCherokeeCheyenneChickasawChileanChineseChippewaChoctawColombianColvilleComancheCosta RicanCreeCreekCroatianCrowCubanCypriotCzechCzechoslovakianDanishDelawareDominicanDutchDutch West IndianEastern EuropeanEcuadorianEgyptianEnglishEstonianEthiopianEuropeanFijianFilipinoFinnishFrenchFrench American IndianFrench CanadianGermanGerman RussianGhanaianGreekGuamanian/ChamorroGuatemalanGuyaneseHaitianHmongHonduranHopiHoumaHungarianIcelanderIndian (Asian)IndonesianInupiatIranianIraqiIrishIroquoisIsraeliItalianJamaicanJapaneseJordanianKenyanKiowaKoreanLaotianLatvianLebaneseLiberianLithuanianLumbeeLuxembourgerMacedonianMalaysianMalteseMarshalleseMenomineeMexicanMexican American IndianMongolianMoroccanNative HawaiianNavajoNepaleseNew ZealanderNicaraguanNigerianNorthern EuropeanNorwegianOkinawanOsageOttawaPaiutePakistaniPalestinianPanamanianParaguayanPennsylvania GermanPeruvianPimaPolishPortuguesePotawatomiPuebloPuerto RicanPuget Sound SalishRomanianRussianSalvadoranSamoanScandinavianScotch-IrishScottishSeminoleSenegaleseSerbianShoshoneSierra LeoneanSiouxSlavicSlovakSloveneSomaliSouth AfricanSouth AmericanSouth American IndianSoviet UnionSpaniardSpanishSpanish AmericanSpanish American IndianSri LankanSubsaharan AfricanSudaneseSwedishSwissSyrianTaiwaneseThaiTlingit-HaidaTohono O'OdhamTonganTrinidadian and TobagonianTsimshianTurkishU.S. Virgin IslanderUgandanUkrainianUruguayanUteVenezuelanVietnameseWelshWest IndianYakamaYaquiYugoslavianYumanYup'ikZimbabwean
Immigration
NonimmigrantsImmigrantsAfghanistanAfricaAlbaniaArgentinaArmeniaAsiaAustraliaAustriaBahamasBangladeshBarbadosBelarusBelgiumBelizeBoliviaBosnia and HerzegovinaBrazilBulgariaBurma/MyanmarCambodiaCameroonCanadaCaribbeanCentral AmericaChileChinaColombiaCongoCosta RicaCroatiaCubaCzechoslovakiaDenmarkDominicaDominican RepublicEastern AfricaEastern AsiaEastern EuropeEcuadorEgyptEl SalvadorEnglandEritreaEthiopiaEuropeFijiFranceGermanyGhanaGreeceGrenadaGuatemalaGuyanaHaitiHondurasHong KongHungaryIndiaIndonesiaIranIraqIrelandIsraelItalyJamaicaJapanJordanKazakhstanKenyaKoreaKuwaitLaosLatin AmericaLatviaLebanonLiberiaLithuaniaMalaysiaMexicoMicronesiaMiddle AfricaMoldovaMoroccoNepalNetherlandsNicaraguaNigeriaNorth AmericaNorth MacedoniaNorthern AfricaNorthern EuropeNorwayOceaniaPakistanPanamaPeruPhilippinesPolandPortugalRomaniaRussiaSaudi ArabiaScotlandSenegalSerbiaSierra LeoneSingaporeSomaliaSouth AfricaSouth AmericaSouth Central AsiaSouth Eastern AsiaSouthern EuropeSpainSri LankaSt. Vincent and the GrenadinesSudanSwedenSwitzerlandSyriaTaiwanThailandTrinidad and TobagoTurkeyUgandaUkraineUruguayUzbekistanVenezuelaVietnamWest IndiesWestern AfricaWestern AsiaWestern EuropeYemenZaireZimbabweAzores
Householder Income Over 65 years
Income
Poverty
Unemployment
Labor Participation
Family Structure
Vehicle Availability
Education Level
Disability

Householder Income Over 65 years Comparison

Immigrants from Cabo Verde

Tongans

Tragic
Exceptional
$46,654
HOUSEHOLDER INCOME OVER 65 YEARS
0.0/ 100
METRIC RATING
342nd/ 347
METRIC RANK
$68,235
HOUSEHOLDER INCOME OVER 65 YEARS
100.0/ 100
METRIC RATING
35th/ 347
METRIC RANK

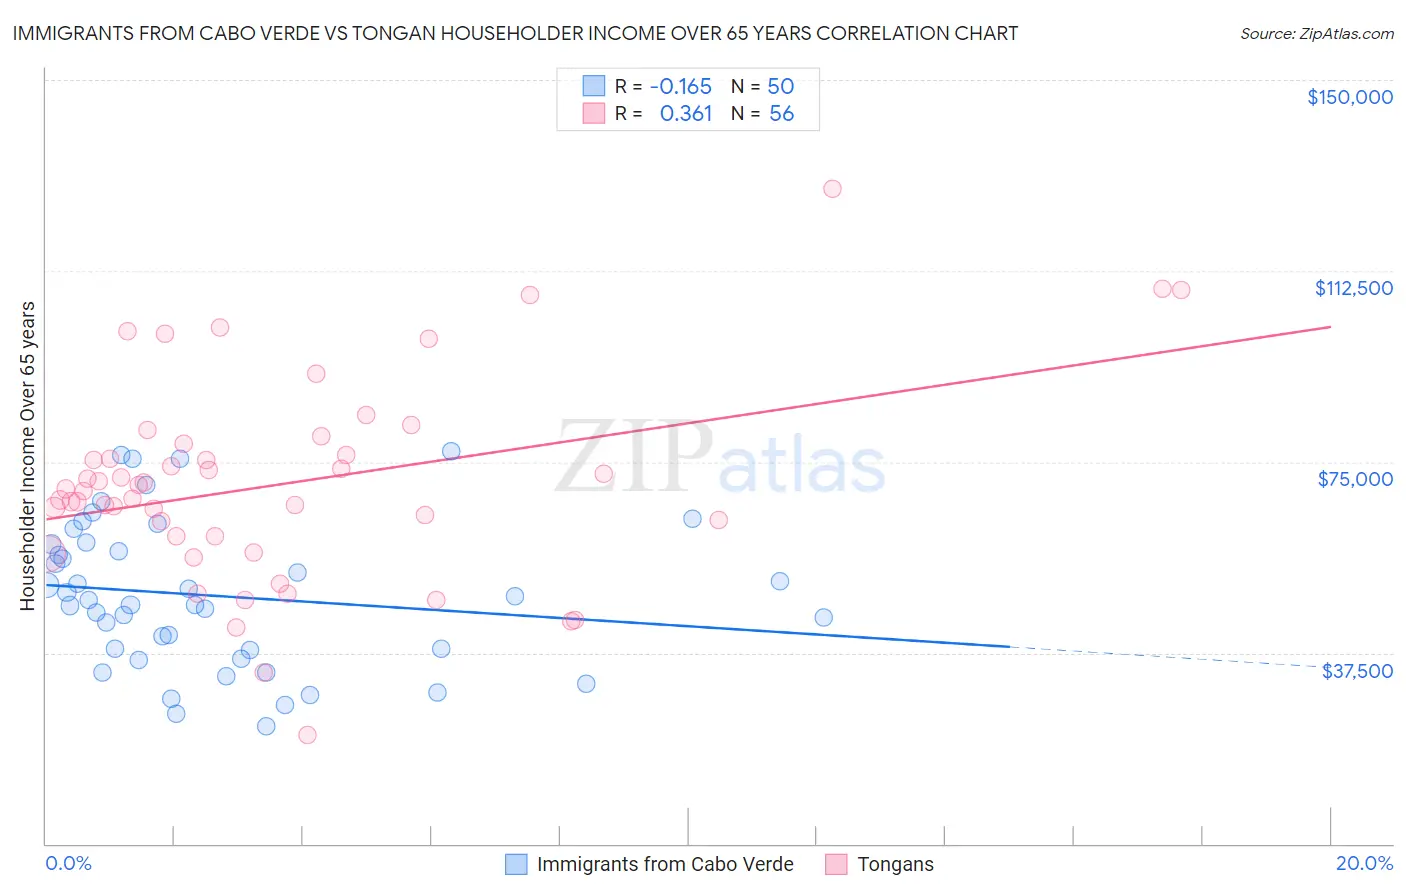
Immigrants from Cabo Verde vs Tongan Householder Income Over 65 years Correlation Chart

The statistical analysis conducted on geographies consisting of 38,089,205 people shows a poor negative correlation between the proportion of Immigrants from Cabo Verde and household income with householder over the age of 65 in the United States with a correlation coefficient (R) of -0.165 and weighted average of $46,654. Similarly, the statistical analysis conducted on geographies consisting of 102,743,666 people shows a mild positive correlation between the proportion of Tongans and household income with householder over the age of 65 in the United States with a correlation coefficient (R) of 0.361 and weighted average of $68,235, a difference of 46.3%.
Immigrants from Cabo Verde vs Tongan Householder Income Over 65 years

Householder Income Over 65 years Correlation Summary

MeasurementImmigrants from Cabo VerdeTongan
Minimum$23,194$21,272
Maximum$77,002$128,750
Range$53,808$107,478
Mean$48,671$70,695
Median$47,365$69,480
Interquartile 25% (IQ1)$38,115$60,415
Interquartile 75% (IQ3)$58,879$77,410
Interquartile Range (IQR)$20,764$16,995
Standard Deviation (Sample)$14,326$19,925
Standard Deviation (Population)$14,182$19,746

Similar Demographics by Householder Income Over 65 years

Demographics Similar to Immigrants from Cabo Verde by Householder Income Over 65 years

In terms of householder income over 65 years, the demographic groups most similar to Immigrants from Cabo Verde are Dominican ($46,964, a difference of 0.66%), Immigrants from Yemen ($47,527, a difference of 1.9%), Immigrants from Dominican Republic ($45,758, a difference of 2.0%), Navajo ($47,722, a difference of 2.3%), and Immigrants from Caribbean ($48,535, a difference of 4.0%).
DemographicsRating | RankHouseholder Income Over 65 years
Cape Verdeans
0.0
/100
|
#333
Tragic
$50,077
Immigrants | Dominica
0.0
/100
|
#334
Tragic
$50,071
Crow
0.0
/100
|
#335
Tragic
$49,234
Cubans
0.0
/100
|
#336
Tragic
$49,152
Tohono O'odham
0.0
/100
|
#337
Tragic
$49,121
Immigrants | Caribbean
0.0
/100
|
#338
Tragic
$48,535
Navajo
0.0
/100
|
#339
Tragic
$47,722
Immigrants | Yemen
0.0
/100
|
#340
Tragic
$47,527
Dominicans
0.0
/100
|
#341
Tragic
$46,964
Immigrants | Cabo Verde
0.0
/100
|
#342
Tragic
$46,654
Immigrants | Dominican Republic
0.0
/100
|
#343
Tragic
$45,758
Houma
0.0
/100
|
#344
Tragic
$44,822
Immigrants | Cuba
0.0
/100
|
#345
Tragic
$44,735
Puerto Ricans
0.0
/100
|
#346
Tragic
$42,550
Lumbee
0.0
/100
|
#347
Tragic
$40,550

Demographics Similar to Tongans by Householder Income Over 65 years

In terms of householder income over 65 years, the demographic groups most similar to Tongans are Immigrants from Austria ($68,208, a difference of 0.040%), Turkish ($68,037, a difference of 0.29%), Immigrants from Ireland ($68,495, a difference of 0.38%), Estonian ($67,926, a difference of 0.46%), and Immigrants from Denmark ($68,801, a difference of 0.83%).
DemographicsRating | RankHouseholder Income Over 65 years
Immigrants | China
100.0
/100
|
#28
Exceptional
$69,174
Immigrants | Australia
100.0
/100
|
#29
Exceptional
$69,164
Immigrants | Northern Europe
100.0
/100
|
#30
Exceptional
$69,003
Afghans
100.0
/100
|
#31
Exceptional
$68,951
Asians
100.0
/100
|
#32
Exceptional
$68,822
Immigrants | Denmark
100.0
/100
|
#33
Exceptional
$68,801
Immigrants | Ireland
100.0
/100
|
#34
Exceptional
$68,495
Tongans
100.0
/100
|
#35
Exceptional
$68,235
Immigrants | Austria
99.9
/100
|
#36
Exceptional
$68,208
Turks
99.9
/100
|
#37
Exceptional
$68,037
Estonians
99.9
/100
|
#38
Exceptional
$67,926
Russians
99.9
/100
|
#39
Exceptional
$67,626
Immigrants | Asia
99.9
/100
|
#40
Exceptional
$67,594
Koreans
99.9
/100
|
#41
Exceptional
$67,472
New Zealanders
99.9
/100
|
#42
Exceptional
$67,333