Immigrants from Cabo Verde vs Estonian Median Male Earnings
COMPARE
Immigrants from Cabo Verde
Estonian
Median Male Earnings
Median Male Earnings Comparison
Immigrants from Cabo Verde
Estonians
$50,009
MEDIAN MALE EARNINGS
1.2/ 100
METRIC RATING
252nd/ 347
METRIC RANK
$61,710
MEDIAN MALE EARNINGS
99.9/ 100
METRIC RATING
51st/ 347
METRIC RANK
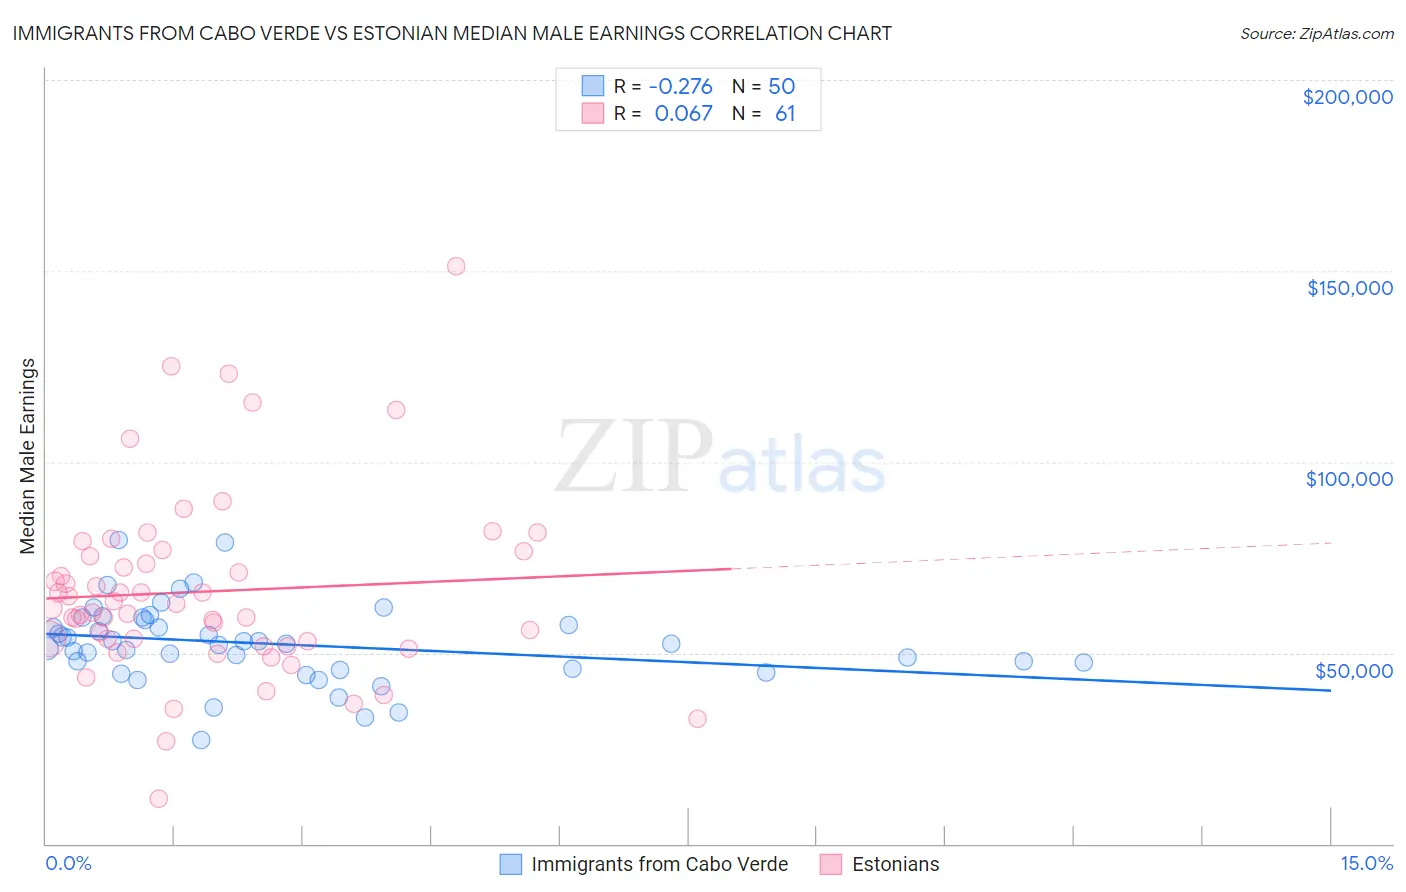
Immigrants from Cabo Verde vs Estonian Median Male Earnings Correlation Chart
The statistical analysis conducted on geographies consisting of 38,152,357 people shows a weak negative correlation between the proportion of Immigrants from Cabo Verde and median male earnings in the United States with a correlation coefficient (R) of -0.276 and weighted average of $50,009. Similarly, the statistical analysis conducted on geographies consisting of 123,512,238 people shows a slight positive correlation between the proportion of Estonians and median male earnings in the United States with a correlation coefficient (R) of 0.067 and weighted average of $61,710, a difference of 23.4%.
Median Male Earnings Correlation Summary
| Measurement | Immigrants from Cabo Verde | Estonian |
| Minimum | $27,292 | $11,700 |
| Maximum | $79,684 | $151,311 |
| Range | $52,392 | $139,611 |
| Mean | $52,373 | $66,018 |
| Median | $52,422 | $61,673 |
| Interquartile 25% (IQ1) | $45,929 | $52,472 |
| Interquartile 75% (IQ3) | $58,666 | $76,012 |
| Interquartile Range (IQR) | $12,737 | $23,541 |
| Standard Deviation (Sample) | $10,362 | $24,287 |
| Standard Deviation (Population) | $10,258 | $24,087 |
Similar Demographics by Median Male Earnings
Demographics Similar to Immigrants from Cabo Verde by Median Male Earnings
In terms of median male earnings, the demographic groups most similar to Immigrants from Cabo Verde are German Russian ($49,924, a difference of 0.17%), Senegalese ($49,774, a difference of 0.47%), Alaskan Athabascan ($49,748, a difference of 0.52%), Immigrants from Grenada ($50,279, a difference of 0.54%), and Osage ($50,292, a difference of 0.57%).
| Demographics | Rating | Rank | Median Male Earnings |
| Hawaiians | 1.9 /100 | #245 | Tragic $50,488 |
| Immigrants | Ecuador | 1.9 /100 | #246 | Tragic $50,474 |
| Sub-Saharan Africans | 1.8 /100 | #247 | Tragic $50,408 |
| Immigrants | Guyana | 1.6 /100 | #248 | Tragic $50,321 |
| Immigrants | Burma/Myanmar | 1.6 /100 | #249 | Tragic $50,298 |
| Osage | 1.6 /100 | #250 | Tragic $50,292 |
| Immigrants | Grenada | 1.6 /100 | #251 | Tragic $50,279 |
| Immigrants | Cabo Verde | 1.2 /100 | #252 | Tragic $50,009 |
| German Russians | 1.1 /100 | #253 | Tragic $49,924 |
| Senegalese | 1.0 /100 | #254 | Tragic $49,774 |
| Alaskan Athabascans | 0.9 /100 | #255 | Tragic $49,748 |
| Alaska Natives | 0.9 /100 | #256 | Tragic $49,711 |
| British West Indians | 0.8 /100 | #257 | Tragic $49,636 |
| Cree | 0.7 /100 | #258 | Tragic $49,497 |
| Nepalese | 0.7 /100 | #259 | Tragic $49,458 |
Demographics Similar to Estonians by Median Male Earnings
In terms of median male earnings, the demographic groups most similar to Estonians are Bhutanese ($61,759, a difference of 0.080%), Immigrants from Norway ($61,628, a difference of 0.13%), South African ($61,460, a difference of 0.41%), Immigrants from Latvia ($61,422, a difference of 0.47%), and Immigrants from Europe ($62,057, a difference of 0.56%).
| Demographics | Rating | Rank | Median Male Earnings |
| Cambodians | 100.0 /100 | #44 | Exceptional $62,516 |
| Bulgarians | 100.0 /100 | #45 | Exceptional $62,378 |
| Immigrants | Czechoslovakia | 99.9 /100 | #46 | Exceptional $62,217 |
| Immigrants | Austria | 99.9 /100 | #47 | Exceptional $62,164 |
| Immigrants | Malaysia | 99.9 /100 | #48 | Exceptional $62,121 |
| Immigrants | Europe | 99.9 /100 | #49 | Exceptional $62,057 |
| Bhutanese | 99.9 /100 | #50 | Exceptional $61,759 |
| Estonians | 99.9 /100 | #51 | Exceptional $61,710 |
| Immigrants | Norway | 99.9 /100 | #52 | Exceptional $61,628 |
| South Africans | 99.9 /100 | #53 | Exceptional $61,460 |
| Immigrants | Latvia | 99.9 /100 | #54 | Exceptional $61,422 |
| Greeks | 99.9 /100 | #55 | Exceptional $61,242 |
| Lithuanians | 99.9 /100 | #56 | Exceptional $61,228 |
| Immigrants | Scotland | 99.9 /100 | #57 | Exceptional $61,220 |
| New Zealanders | 99.9 /100 | #58 | Exceptional $61,199 |