Immigrants from Burma/Myanmar vs Czech Householder Income Over 65 years
COMPARE
Immigrants from Burma/Myanmar
Czech
Householder Income Over 65 years
Householder Income Over 65 years Comparison
Immigrants from Burma/Myanmar
Czechs
$57,114
HOUSEHOLDER INCOME OVER 65 YEARS
1.7/ 100
METRIC RATING
234th/ 347
METRIC RANK
$61,244
HOUSEHOLDER INCOME OVER 65 YEARS
57.2/ 100
METRIC RATING
162nd/ 347
METRIC RANK
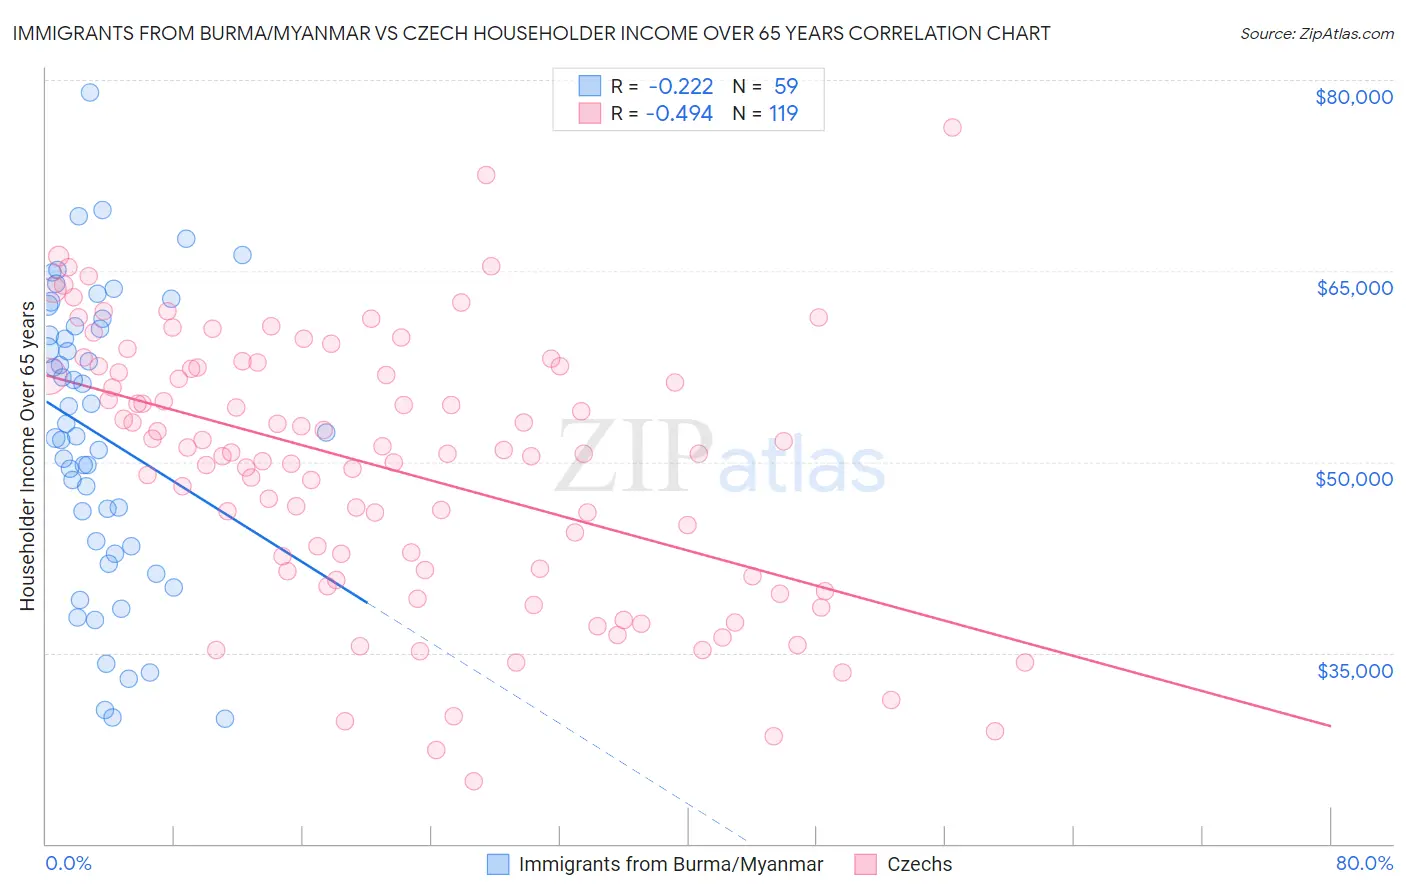
Immigrants from Burma/Myanmar vs Czech Householder Income Over 65 years Correlation Chart
The statistical analysis conducted on geographies consisting of 172,033,501 people shows a weak negative correlation between the proportion of Immigrants from Burma/Myanmar and household income with householder over the age of 65 in the United States with a correlation coefficient (R) of -0.222 and weighted average of $57,114. Similarly, the statistical analysis conducted on geographies consisting of 482,438,211 people shows a moderate negative correlation between the proportion of Czechs and household income with householder over the age of 65 in the United States with a correlation coefficient (R) of -0.494 and weighted average of $61,244, a difference of 7.2%.
Householder Income Over 65 years Correlation Summary
| Measurement | Immigrants from Burma/Myanmar | Czech |
| Minimum | $29,861 | $24,894 |
| Maximum | $78,969 | $76,250 |
| Range | $49,108 | $51,356 |
| Mean | $52,112 | $49,506 |
| Median | $52,321 | $50,665 |
| Interquartile 25% (IQ1) | $43,364 | $41,396 |
| Interquartile 75% (IQ3) | $60,699 | $57,446 |
| Interquartile Range (IQR) | $17,335 | $16,049 |
| Standard Deviation (Sample) | $11,315 | $10,394 |
| Standard Deviation (Population) | $11,219 | $10,351 |
Similar Demographics by Householder Income Over 65 years
Demographics Similar to Immigrants from Burma/Myanmar by Householder Income Over 65 years
In terms of householder income over 65 years, the demographic groups most similar to Immigrants from Burma/Myanmar are Immigrants from Western Africa ($57,119, a difference of 0.010%), Spanish American ($57,021, a difference of 0.16%), Immigrants from Uruguay ($56,975, a difference of 0.24%), Immigrants from Panama ($56,944, a difference of 0.30%), and Immigrants from Venezuela ($57,371, a difference of 0.45%).
| Demographics | Rating | Rank | Householder Income Over 65 years |
| Japanese | 3.9 /100 | #227 | Tragic $57,919 |
| Immigrants | Albania | 3.6 /100 | #228 | Tragic $57,828 |
| Immigrants | Colombia | 3.0 /100 | #229 | Tragic $57,658 |
| Immigrants | Cambodia | 2.8 /100 | #230 | Tragic $57,580 |
| Immigrants | Nonimmigrants | 2.4 /100 | #231 | Tragic $57,426 |
| Immigrants | Venezuela | 2.3 /100 | #232 | Tragic $57,371 |
| Immigrants | Western Africa | 1.7 /100 | #233 | Tragic $57,119 |
| Immigrants | Burma/Myanmar | 1.7 /100 | #234 | Tragic $57,114 |
| Spanish Americans | 1.6 /100 | #235 | Tragic $57,021 |
| Immigrants | Uruguay | 1.5 /100 | #236 | Tragic $56,975 |
| Immigrants | Panama | 1.5 /100 | #237 | Tragic $56,944 |
| Fijians | 1.2 /100 | #238 | Tragic $56,768 |
| Immigrants | Laos | 1.2 /100 | #239 | Tragic $56,722 |
| Sub-Saharan Africans | 1.0 /100 | #240 | Tragic $56,615 |
| Immigrants | Guyana | 0.9 /100 | #241 | Tragic $56,495 |
Demographics Similar to Czechs by Householder Income Over 65 years
In terms of householder income over 65 years, the demographic groups most similar to Czechs are Icelander ($61,270, a difference of 0.040%), Ugandan ($61,177, a difference of 0.11%), Immigrants from North Macedonia ($61,175, a difference of 0.11%), Immigrants from Ukraine ($61,163, a difference of 0.13%), and Immigrants from Eastern Africa ($61,157, a difference of 0.14%).
| Demographics | Rating | Rank | Householder Income Over 65 years |
| Poles | 65.9 /100 | #155 | Good $61,598 |
| Scandinavians | 65.6 /100 | #156 | Good $61,586 |
| Macedonians | 65.1 /100 | #157 | Good $61,564 |
| English | 63.3 /100 | #158 | Good $61,487 |
| Brazilians | 62.7 /100 | #159 | Good $61,465 |
| Portuguese | 62.1 /100 | #160 | Good $61,440 |
| Icelanders | 57.9 /100 | #161 | Average $61,270 |
| Czechs | 57.2 /100 | #162 | Average $61,244 |
| Ugandans | 55.5 /100 | #163 | Average $61,177 |
| Immigrants | North Macedonia | 55.4 /100 | #164 | Average $61,175 |
| Immigrants | Ukraine | 55.1 /100 | #165 | Average $61,163 |
| Immigrants | Eastern Africa | 55.0 /100 | #166 | Average $61,157 |
| Norwegians | 53.6 /100 | #167 | Average $61,104 |
| Irish | 53.4 /100 | #168 | Average $61,097 |
| Carpatho Rusyns | 53.3 /100 | #169 | Average $61,093 |