Immigrants from Burma/Myanmar vs British West Indian Median Family Income
COMPARE
Immigrants from Burma/Myanmar
British West Indian
Median Family Income
Median Family Income Comparison
Immigrants from Burma/Myanmar
British West Indians
$94,472
MEDIAN FAMILY INCOME
1.5/ 100
METRIC RATING
235th/ 347
METRIC RANK
$88,987
MEDIAN FAMILY INCOME
0.1/ 100
METRIC RATING
280th/ 347
METRIC RANK
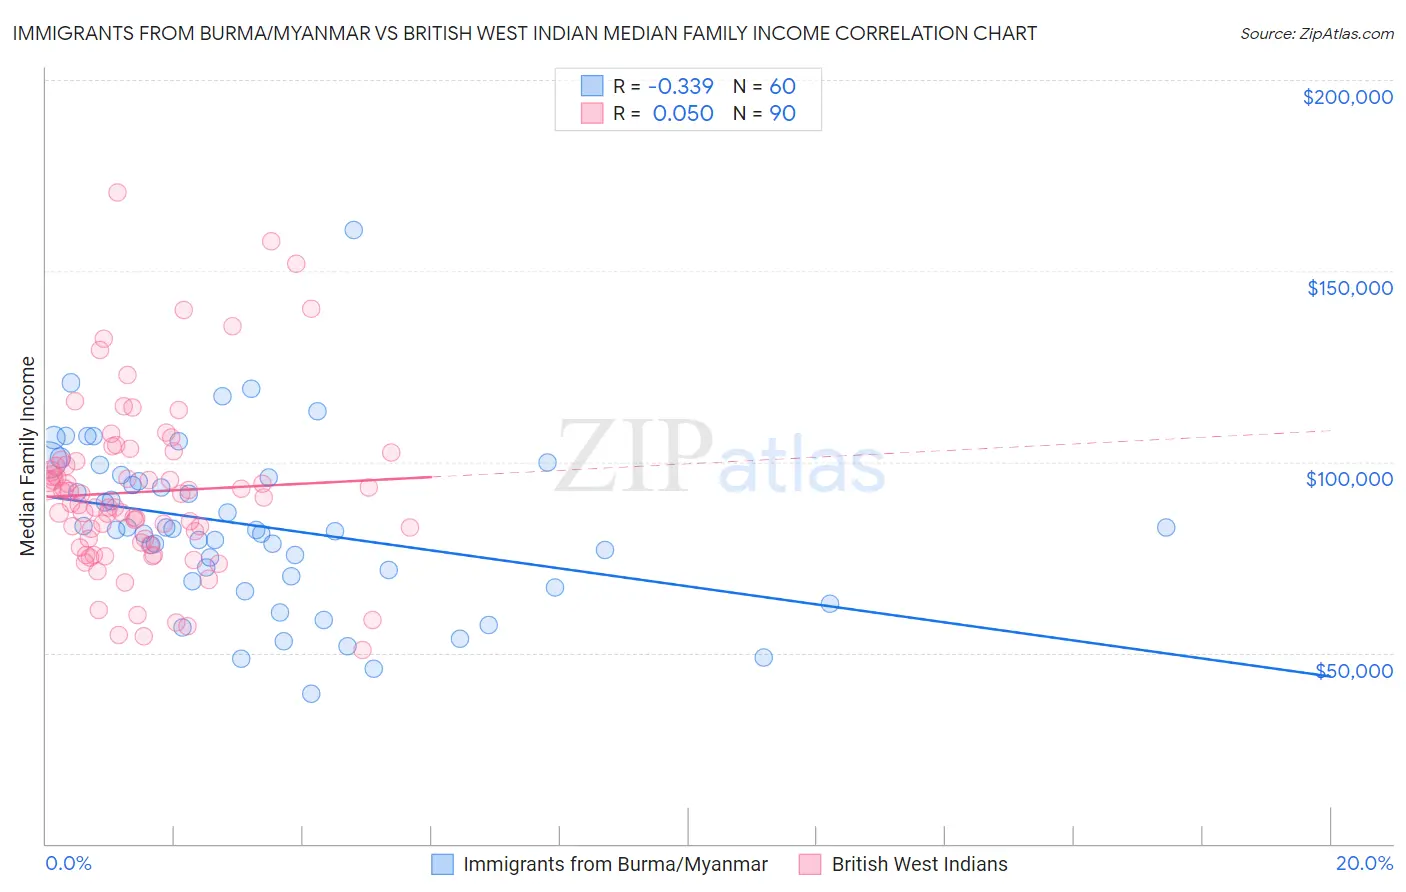
Immigrants from Burma/Myanmar vs British West Indian Median Family Income Correlation Chart
The statistical analysis conducted on geographies consisting of 172,231,822 people shows a mild negative correlation between the proportion of Immigrants from Burma/Myanmar and median family income in the United States with a correlation coefficient (R) of -0.339 and weighted average of $94,472. Similarly, the statistical analysis conducted on geographies consisting of 152,609,449 people shows no correlation between the proportion of British West Indians and median family income in the United States with a correlation coefficient (R) of 0.050 and weighted average of $88,987, a difference of 6.2%.
Median Family Income Correlation Summary
| Measurement | Immigrants from Burma/Myanmar | British West Indian |
| Minimum | $39,136 | $50,788 |
| Maximum | $160,863 | $170,703 |
| Range | $121,727 | $119,915 |
| Mean | $83,083 | $92,168 |
| Median | $82,122 | $89,815 |
| Interquartile 25% (IQ1) | $69,331 | $78,814 |
| Interquartile 75% (IQ3) | $96,286 | $100,192 |
| Interquartile Range (IQR) | $26,955 | $21,378 |
| Standard Deviation (Sample) | $21,974 | $22,307 |
| Standard Deviation (Population) | $21,790 | $22,182 |
Similar Demographics by Median Family Income
Demographics Similar to Immigrants from Burma/Myanmar by Median Family Income
In terms of median family income, the demographic groups most similar to Immigrants from Burma/Myanmar are Trinidadian and Tobagonian ($94,466, a difference of 0.010%), Alaskan Athabascan ($94,429, a difference of 0.040%), Immigrants from Western Africa ($94,638, a difference of 0.18%), Immigrants from Bangladesh ($94,665, a difference of 0.20%), and Nepalese ($94,153, a difference of 0.34%).
| Demographics | Rating | Rank | Median Family Income |
| Immigrants | Azores | 2.4 /100 | #228 | Tragic $95,402 |
| Marshallese | 2.2 /100 | #229 | Tragic $95,293 |
| Malaysians | 2.2 /100 | #230 | Tragic $95,230 |
| Ecuadorians | 2.1 /100 | #231 | Tragic $95,114 |
| Immigrants | Venezuela | 1.9 /100 | #232 | Tragic $94,904 |
| Immigrants | Bangladesh | 1.6 /100 | #233 | Tragic $94,665 |
| Immigrants | Western Africa | 1.6 /100 | #234 | Tragic $94,638 |
| Immigrants | Burma/Myanmar | 1.5 /100 | #235 | Tragic $94,472 |
| Trinidadians and Tobagonians | 1.5 /100 | #236 | Tragic $94,466 |
| Alaskan Athabascans | 1.5 /100 | #237 | Tragic $94,429 |
| Nepalese | 1.3 /100 | #238 | Tragic $94,153 |
| Salvadorans | 1.2 /100 | #239 | Tragic $94,109 |
| Somalis | 1.2 /100 | #240 | Tragic $94,085 |
| Immigrants | Trinidad and Tobago | 1.2 /100 | #241 | Tragic $93,988 |
| Barbadians | 1.1 /100 | #242 | Tragic $93,919 |
Demographics Similar to British West Indians by Median Family Income
In terms of median family income, the demographic groups most similar to British West Indians are Immigrants from Belize ($89,197, a difference of 0.24%), Immigrants from Grenada ($89,249, a difference of 0.29%), Blackfeet ($88,717, a difference of 0.30%), Immigrants from Jamaica ($89,268, a difference of 0.32%), and Immigrants from Zaire ($89,285, a difference of 0.33%).
| Demographics | Rating | Rank | Median Family Income |
| Immigrants | Micronesia | 0.2 /100 | #273 | Tragic $90,345 |
| Spanish Americans | 0.2 /100 | #274 | Tragic $90,322 |
| Immigrants | St. Vincent and the Grenadines | 0.2 /100 | #275 | Tragic $90,094 |
| Immigrants | Zaire | 0.1 /100 | #276 | Tragic $89,285 |
| Immigrants | Jamaica | 0.1 /100 | #277 | Tragic $89,268 |
| Immigrants | Grenada | 0.1 /100 | #278 | Tragic $89,249 |
| Immigrants | Belize | 0.1 /100 | #279 | Tragic $89,197 |
| British West Indians | 0.1 /100 | #280 | Tragic $88,987 |
| Blackfeet | 0.1 /100 | #281 | Tragic $88,717 |
| Comanche | 0.1 /100 | #282 | Tragic $88,556 |
| Bangladeshis | 0.1 /100 | #283 | Tragic $88,358 |
| Indonesians | 0.1 /100 | #284 | Tragic $88,301 |
| Guatemalans | 0.1 /100 | #285 | Tragic $88,295 |
| Immigrants | Nicaragua | 0.1 /100 | #286 | Tragic $88,267 |
| Potawatomi | 0.1 /100 | #287 | Tragic $88,265 |