Immigrants from Brazil vs Immigrants from Cabo Verde Median Earnings
COMPARE
Immigrants from Brazil
Immigrants from Cabo Verde
Median Earnings
Median Earnings Comparison
Immigrants from Brazil
Immigrants from Cabo Verde
$49,463
MEDIAN EARNINGS
98.6/ 100
METRIC RATING
104th/ 347
METRIC RANK
$43,963
MEDIAN EARNINGS
3.0/ 100
METRIC RATING
247th/ 347
METRIC RANK
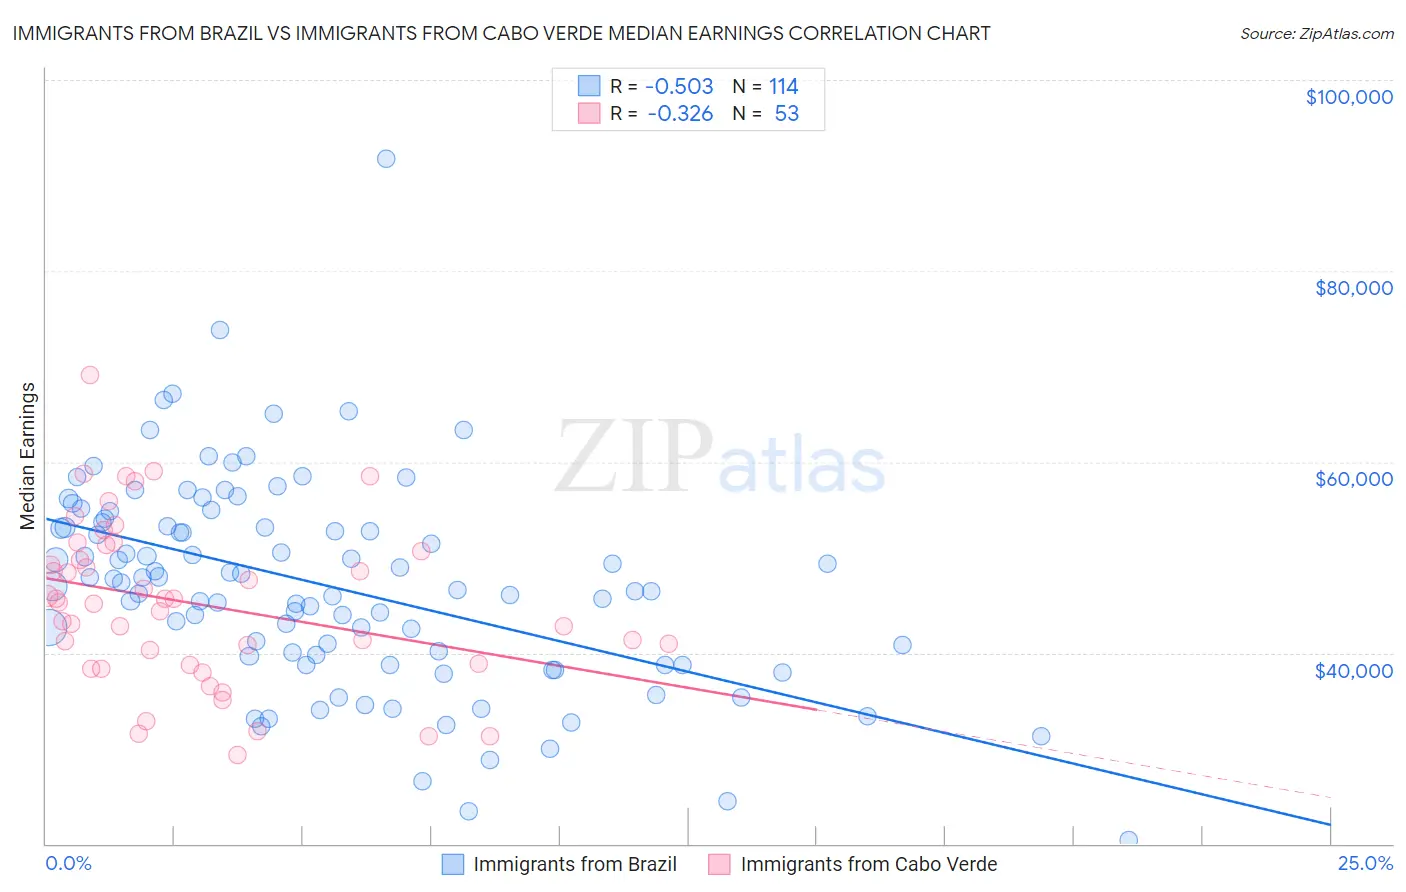
Immigrants from Brazil vs Immigrants from Cabo Verde Median Earnings Correlation Chart
The statistical analysis conducted on geographies consisting of 343,004,043 people shows a substantial negative correlation between the proportion of Immigrants from Brazil and median earnings in the United States with a correlation coefficient (R) of -0.503 and weighted average of $49,463. Similarly, the statistical analysis conducted on geographies consisting of 38,158,666 people shows a mild negative correlation between the proportion of Immigrants from Cabo Verde and median earnings in the United States with a correlation coefficient (R) of -0.326 and weighted average of $43,963, a difference of 12.5%.
Median Earnings Correlation Summary
| Measurement | Immigrants from Brazil | Immigrants from Cabo Verde |
| Minimum | $20,417 | $29,297 |
| Maximum | $91,768 | $69,097 |
| Range | $71,351 | $39,800 |
| Mean | $47,008 | $45,169 |
| Median | $47,178 | $45,280 |
| Interquartile 25% (IQ1) | $39,617 | $38,744 |
| Interquartile 75% (IQ3) | $53,219 | $50,961 |
| Interquartile Range (IQR) | $13,601 | $12,217 |
| Standard Deviation (Sample) | $10,976 | $8,556 |
| Standard Deviation (Population) | $10,928 | $8,475 |
Similar Demographics by Median Earnings
Demographics Similar to Immigrants from Brazil by Median Earnings
In terms of median earnings, the demographic groups most similar to Immigrants from Brazil are Austrian ($49,501, a difference of 0.080%), Immigrants from Western Asia ($49,389, a difference of 0.15%), Immigrants from Albania ($49,377, a difference of 0.17%), Immigrants from Morocco ($49,368, a difference of 0.19%), and Ethiopian ($49,572, a difference of 0.22%).
| Demographics | Rating | Rank | Median Earnings |
| Immigrants | North Macedonia | 98.9 /100 | #97 | Exceptional $49,658 |
| Immigrants | Northern Africa | 98.9 /100 | #98 | Exceptional $49,648 |
| Immigrants | Afghanistan | 98.9 /100 | #99 | Exceptional $49,645 |
| Immigrants | Poland | 98.9 /100 | #100 | Exceptional $49,633 |
| Jordanians | 98.9 /100 | #101 | Exceptional $49,632 |
| Ethiopians | 98.8 /100 | #102 | Exceptional $49,572 |
| Austrians | 98.7 /100 | #103 | Exceptional $49,501 |
| Immigrants | Brazil | 98.6 /100 | #104 | Exceptional $49,463 |
| Immigrants | Western Asia | 98.4 /100 | #105 | Exceptional $49,389 |
| Immigrants | Albania | 98.4 /100 | #106 | Exceptional $49,377 |
| Immigrants | Morocco | 98.4 /100 | #107 | Exceptional $49,368 |
| Palestinians | 98.0 /100 | #108 | Exceptional $49,209 |
| Syrians | 97.1 /100 | #109 | Exceptional $48,934 |
| Immigrants | Ethiopia | 97.1 /100 | #110 | Exceptional $48,924 |
| Immigrants | Zimbabwe | 97.0 /100 | #111 | Exceptional $48,913 |
Demographics Similar to Immigrants from Cabo Verde by Median Earnings
In terms of median earnings, the demographic groups most similar to Immigrants from Cabo Verde are Immigrants from West Indies ($43,989, a difference of 0.060%), Immigrants from Burma/Myanmar ($43,998, a difference of 0.080%), Nepalese ($43,860, a difference of 0.24%), Malaysian ($43,844, a difference of 0.27%), and Subsaharan African ($44,118, a difference of 0.35%).
| Demographics | Rating | Rank | Median Earnings |
| Aleuts | 4.4 /100 | #240 | Tragic $44,241 |
| Samoans | 4.2 /100 | #241 | Tragic $44,206 |
| Immigrants | Venezuela | 4.0 /100 | #242 | Tragic $44,163 |
| Sub-Saharan Africans | 3.7 /100 | #243 | Tragic $44,118 |
| Immigrants | Nonimmigrants | 3.7 /100 | #244 | Tragic $44,117 |
| Immigrants | Burma/Myanmar | 3.2 /100 | #245 | Tragic $43,998 |
| Immigrants | West Indies | 3.1 /100 | #246 | Tragic $43,989 |
| Immigrants | Cabo Verde | 3.0 /100 | #247 | Tragic $43,963 |
| Nepalese | 2.6 /100 | #248 | Tragic $43,860 |
| Malaysians | 2.6 /100 | #249 | Tragic $43,844 |
| Alaska Natives | 2.3 /100 | #250 | Tragic $43,750 |
| Tsimshian | 2.1 /100 | #251 | Tragic $43,695 |
| Hawaiians | 2.0 /100 | #252 | Tragic $43,673 |
| Somalis | 1.8 /100 | #253 | Tragic $43,567 |
| Liberians | 1.7 /100 | #254 | Tragic $43,536 |