Immigrants from Bosnia and Herzegovina vs Northern European Householder Income Ages 45 - 64 years
COMPARE
Immigrants from Bosnia and Herzegovina
Northern European
Householder Income Ages 45 - 64 years
Householder Income Ages 45 - 64 years Comparison
Immigrants from Bosnia and Herzegovina
Northern Europeans
$94,288
HOUSEHOLDER INCOME AGES 45 - 64 YEARS
4.6/ 100
METRIC RATING
224th/ 347
METRIC RANK
$107,870
HOUSEHOLDER INCOME AGES 45 - 64 YEARS
97.8/ 100
METRIC RATING
97th/ 347
METRIC RANK
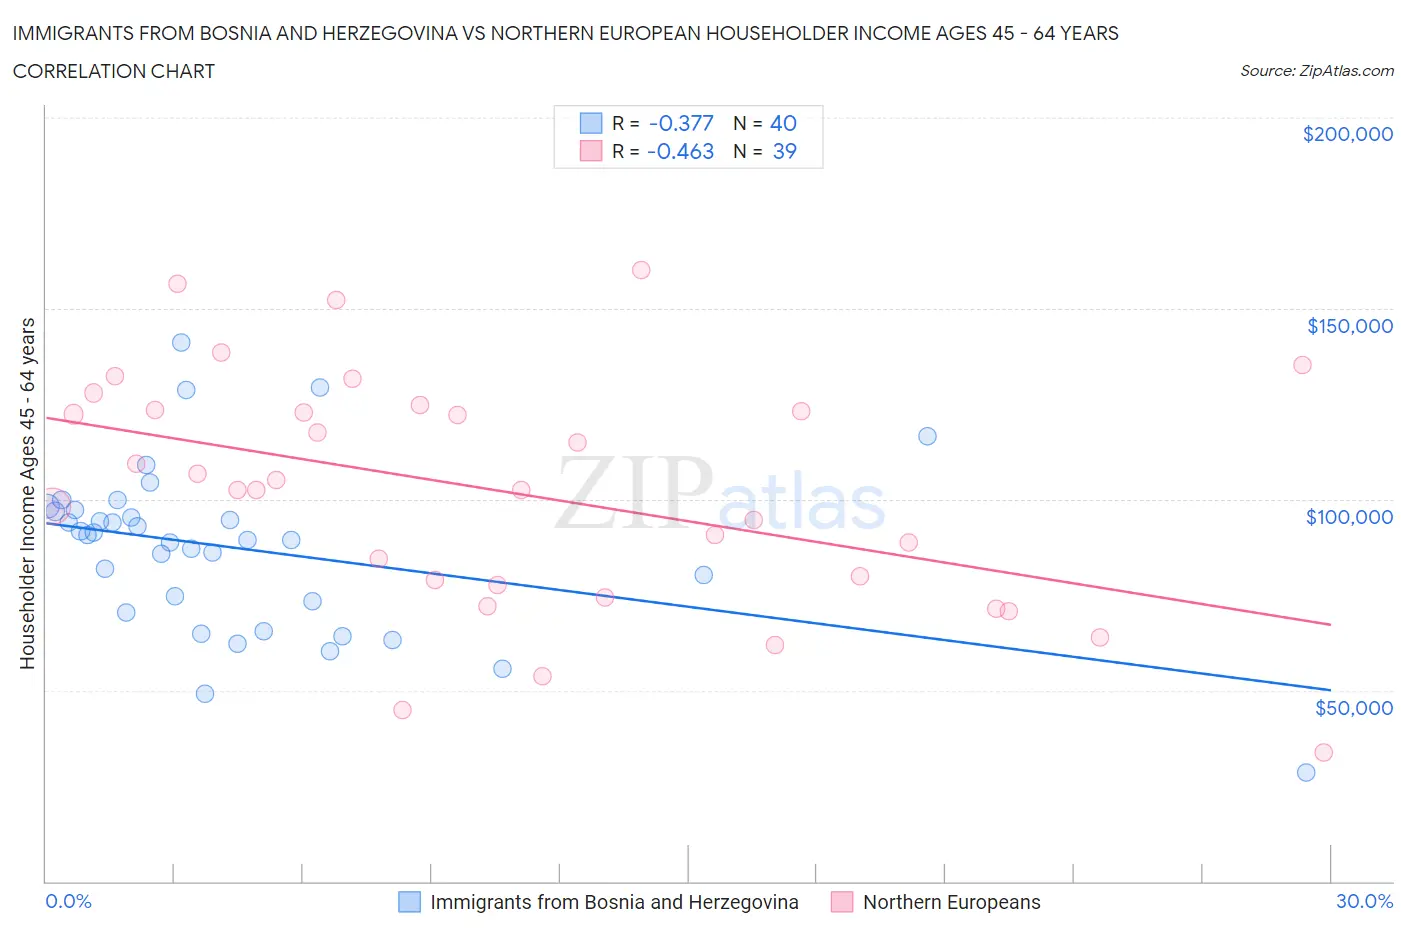
Immigrants from Bosnia and Herzegovina vs Northern European Householder Income Ages 45 - 64 years Correlation Chart
The statistical analysis conducted on geographies consisting of 156,795,002 people shows a mild negative correlation between the proportion of Immigrants from Bosnia and Herzegovina and household income with householder between the ages 45 and 64 in the United States with a correlation coefficient (R) of -0.377 and weighted average of $94,288. Similarly, the statistical analysis conducted on geographies consisting of 405,435,990 people shows a moderate negative correlation between the proportion of Northern Europeans and household income with householder between the ages 45 and 64 in the United States with a correlation coefficient (R) of -0.463 and weighted average of $107,870, a difference of 14.4%.
Householder Income Ages 45 - 64 years Correlation Summary
| Measurement | Immigrants from Bosnia and Herzegovina | Northern European |
| Minimum | $28,542 | $33,594 |
| Maximum | $140,991 | $160,179 |
| Range | $112,449 | $126,585 |
| Mean | $87,003 | $101,869 |
| Median | $90,049 | $102,539 |
| Interquartile 25% (IQ1) | $71,932 | $77,586 |
| Interquartile 75% (IQ3) | $97,030 | $123,289 |
| Interquartile Range (IQR) | $25,098 | $45,703 |
| Standard Deviation (Sample) | $22,077 | $30,827 |
| Standard Deviation (Population) | $21,799 | $30,430 |
Similar Demographics by Householder Income Ages 45 - 64 years
Demographics Similar to Immigrants from Bosnia and Herzegovina by Householder Income Ages 45 - 64 years
In terms of householder income ages 45 - 64 years, the demographic groups most similar to Immigrants from Bosnia and Herzegovina are Bermudan ($94,197, a difference of 0.10%), Immigrants from the Azores ($94,138, a difference of 0.16%), Nonimmigrants ($94,448, a difference of 0.17%), Malaysian ($94,517, a difference of 0.24%), and Alaska Native ($93,991, a difference of 0.32%).
| Demographics | Rating | Rank | Householder Income Ages 45 - 64 years |
| Immigrants | Ghana | 6.4 /100 | #217 | Tragic $94,982 |
| Delaware | 6.2 /100 | #218 | Tragic $94,914 |
| Immigrants | Armenia | 6.1 /100 | #219 | Tragic $94,863 |
| Salvadorans | 6.0 /100 | #220 | Tragic $94,842 |
| Immigrants | Nigeria | 5.9 /100 | #221 | Tragic $94,804 |
| Malaysians | 5.2 /100 | #222 | Tragic $94,517 |
| Immigrants | Nonimmigrants | 5.0 /100 | #223 | Tragic $94,448 |
| Immigrants | Bosnia and Herzegovina | 4.6 /100 | #224 | Tragic $94,288 |
| Bermudans | 4.4 /100 | #225 | Tragic $94,197 |
| Immigrants | Azores | 4.3 /100 | #226 | Tragic $94,138 |
| Alaska Natives | 4.0 /100 | #227 | Tragic $93,991 |
| Immigrants | Panama | 3.7 /100 | #228 | Tragic $93,815 |
| Vietnamese | 3.6 /100 | #229 | Tragic $93,788 |
| Immigrants | Sudan | 3.6 /100 | #230 | Tragic $93,781 |
| Ecuadorians | 3.6 /100 | #231 | Tragic $93,739 |
Demographics Similar to Northern Europeans by Householder Income Ages 45 - 64 years
In terms of householder income ages 45 - 64 years, the demographic groups most similar to Northern Europeans are Immigrants from Southern Europe ($107,775, a difference of 0.090%), Palestinian ($107,721, a difference of 0.14%), Immigrants from Serbia ($107,569, a difference of 0.28%), Sri Lankan ($108,270, a difference of 0.37%), and Immigrants from Hungary ($108,267, a difference of 0.37%).
| Demographics | Rating | Rank | Householder Income Ages 45 - 64 years |
| Immigrants | Philippines | 98.3 /100 | #90 | Exceptional $108,471 |
| Immigrants | Lebanon | 98.3 /100 | #91 | Exceptional $108,471 |
| Croatians | 98.3 /100 | #92 | Exceptional $108,383 |
| Immigrants | Croatia | 98.2 /100 | #93 | Exceptional $108,304 |
| Sri Lankans | 98.2 /100 | #94 | Exceptional $108,270 |
| Immigrants | Hungary | 98.2 /100 | #95 | Exceptional $108,267 |
| Immigrants | Argentina | 98.2 /100 | #96 | Exceptional $108,264 |
| Northern Europeans | 97.8 /100 | #97 | Exceptional $107,870 |
| Immigrants | Southern Europe | 97.7 /100 | #98 | Exceptional $107,775 |
| Palestinians | 97.6 /100 | #99 | Exceptional $107,721 |
| Immigrants | Serbia | 97.4 /100 | #100 | Exceptional $107,569 |
| Immigrants | Kazakhstan | 97.2 /100 | #101 | Exceptional $107,378 |
| Immigrants | Moldova | 97.1 /100 | #102 | Exceptional $107,357 |
| Syrians | 96.9 /100 | #103 | Exceptional $107,207 |
| Immigrants | Ukraine | 96.7 /100 | #104 | Exceptional $107,079 |