Immigrants from Bosnia and Herzegovina vs Immigrants Per Capita Income
COMPARE
Immigrants from Bosnia and Herzegovina
Immigrants
Per Capita Income
Per Capita Income Comparison
Immigrants from Bosnia and Herzegovina
Immigrants
$42,278
PER CAPITA INCOME
17.5/ 100
METRIC RATING
202nd/ 347
METRIC RANK
$43,010
PER CAPITA INCOME
32.5/ 100
METRIC RATING
185th/ 347
METRIC RANK
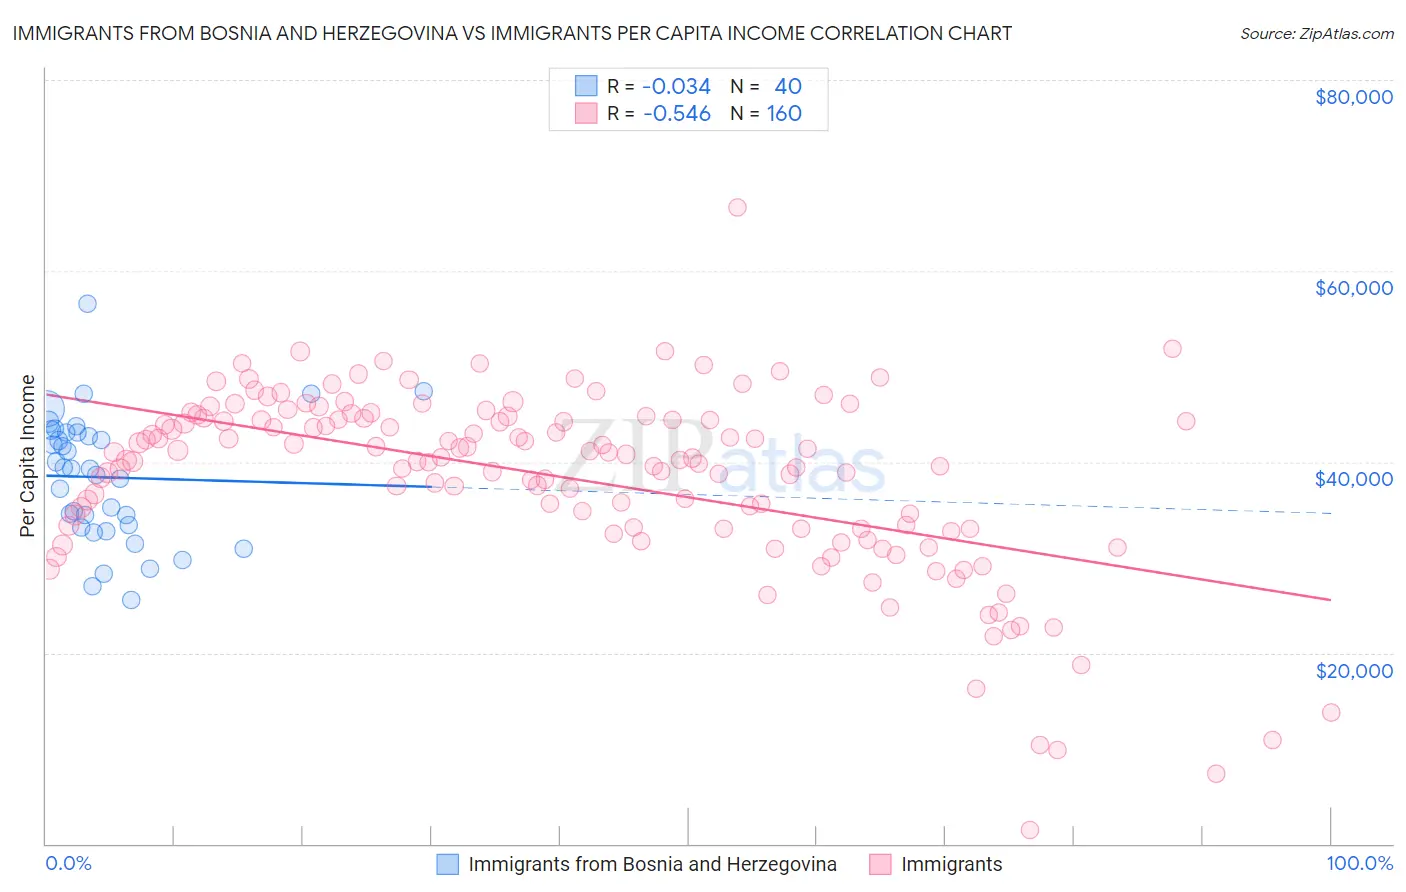
Immigrants from Bosnia and Herzegovina vs Immigrants Per Capita Income Correlation Chart
The statistical analysis conducted on geographies consisting of 156,819,615 people shows no correlation between the proportion of Immigrants from Bosnia and Herzegovina and per capita income in the United States with a correlation coefficient (R) of -0.034 and weighted average of $42,278. Similarly, the statistical analysis conducted on geographies consisting of 577,833,144 people shows a substantial negative correlation between the proportion of Immigrants and per capita income in the United States with a correlation coefficient (R) of -0.546 and weighted average of $43,010, a difference of 1.7%.
Per Capita Income Correlation Summary
| Measurement | Immigrants from Bosnia and Herzegovina | Immigrants |
| Minimum | $25,485 | $1,397 |
| Maximum | $56,549 | $66,654 |
| Range | $31,064 | $65,257 |
| Mean | $38,380 | $38,278 |
| Median | $39,263 | $40,300 |
| Interquartile 25% (IQ1) | $33,229 | $33,050 |
| Interquartile 75% (IQ3) | $43,067 | $44,506 |
| Interquartile Range (IQR) | $9,838 | $11,456 |
| Standard Deviation (Sample) | $6,628 | $9,625 |
| Standard Deviation (Population) | $6,545 | $9,595 |
Demographics Similar to Immigrants from Bosnia and Herzegovina and Immigrants by Per Capita Income
In terms of per capita income, the demographic groups most similar to Immigrants from Bosnia and Herzegovina are Immigrants from Thailand ($42,289, a difference of 0.030%), Spanish ($42,249, a difference of 0.070%), Vietnamese ($42,368, a difference of 0.21%), Barbadian ($42,406, a difference of 0.30%), and Immigrants from Portugal ($42,412, a difference of 0.32%). Similarly, the demographic groups most similar to Immigrants are French Canadian ($43,003, a difference of 0.020%), Spaniard ($43,028, a difference of 0.040%), Immigrants from Colombia ($42,971, a difference of 0.090%), German ($43,067, a difference of 0.13%), and Immigrants from Africa ($42,950, a difference of 0.14%).
| Demographics | Rating | Rank | Per Capita Income |
| Germans | 33.9 /100 | #183 | Fair $43,067 |
| Spaniards | 32.9 /100 | #184 | Fair $43,028 |
| Immigrants | Immigrants | 32.5 /100 | #185 | Fair $43,010 |
| French Canadians | 32.3 /100 | #186 | Fair $43,003 |
| Immigrants | Colombia | 31.5 /100 | #187 | Fair $42,971 |
| Immigrants | Africa | 31.0 /100 | #188 | Fair $42,950 |
| Bermudans | 30.1 /100 | #189 | Fair $42,911 |
| Kenyans | 27.7 /100 | #190 | Fair $42,808 |
| Yugoslavians | 27.4 /100 | #191 | Fair $42,792 |
| Iraqis | 26.7 /100 | #192 | Fair $42,760 |
| Immigrants | Sierra Leone | 26.5 /100 | #193 | Fair $42,752 |
| Immigrants | Fiji | 25.2 /100 | #194 | Fair $42,694 |
| Immigrants | Kenya | 24.5 /100 | #195 | Fair $42,661 |
| Dutch | 23.4 /100 | #196 | Fair $42,605 |
| Scotch-Irish | 22.6 /100 | #197 | Fair $42,563 |
| Immigrants | Portugal | 19.7 /100 | #198 | Poor $42,412 |
| Barbadians | 19.6 /100 | #199 | Poor $42,406 |
| Vietnamese | 19.0 /100 | #200 | Poor $42,368 |
| Immigrants | Thailand | 17.6 /100 | #201 | Poor $42,289 |
| Immigrants | Bosnia and Herzegovina | 17.5 /100 | #202 | Poor $42,278 |
| Spanish | 17.0 /100 | #203 | Poor $42,249 |