Immigrants from Bosnia and Herzegovina vs Immigrants from Iraq Median Earnings
COMPARE
Immigrants from Bosnia and Herzegovina
Immigrants from Iraq
Median Earnings
Median Earnings Comparison
Immigrants from Bosnia and Herzegovina
Immigrants from Iraq
$45,600
MEDIAN EARNINGS
23.7/ 100
METRIC RATING
208th/ 347
METRIC RANK
$44,988
MEDIAN EARNINGS
11.6/ 100
METRIC RATING
228th/ 347
METRIC RANK
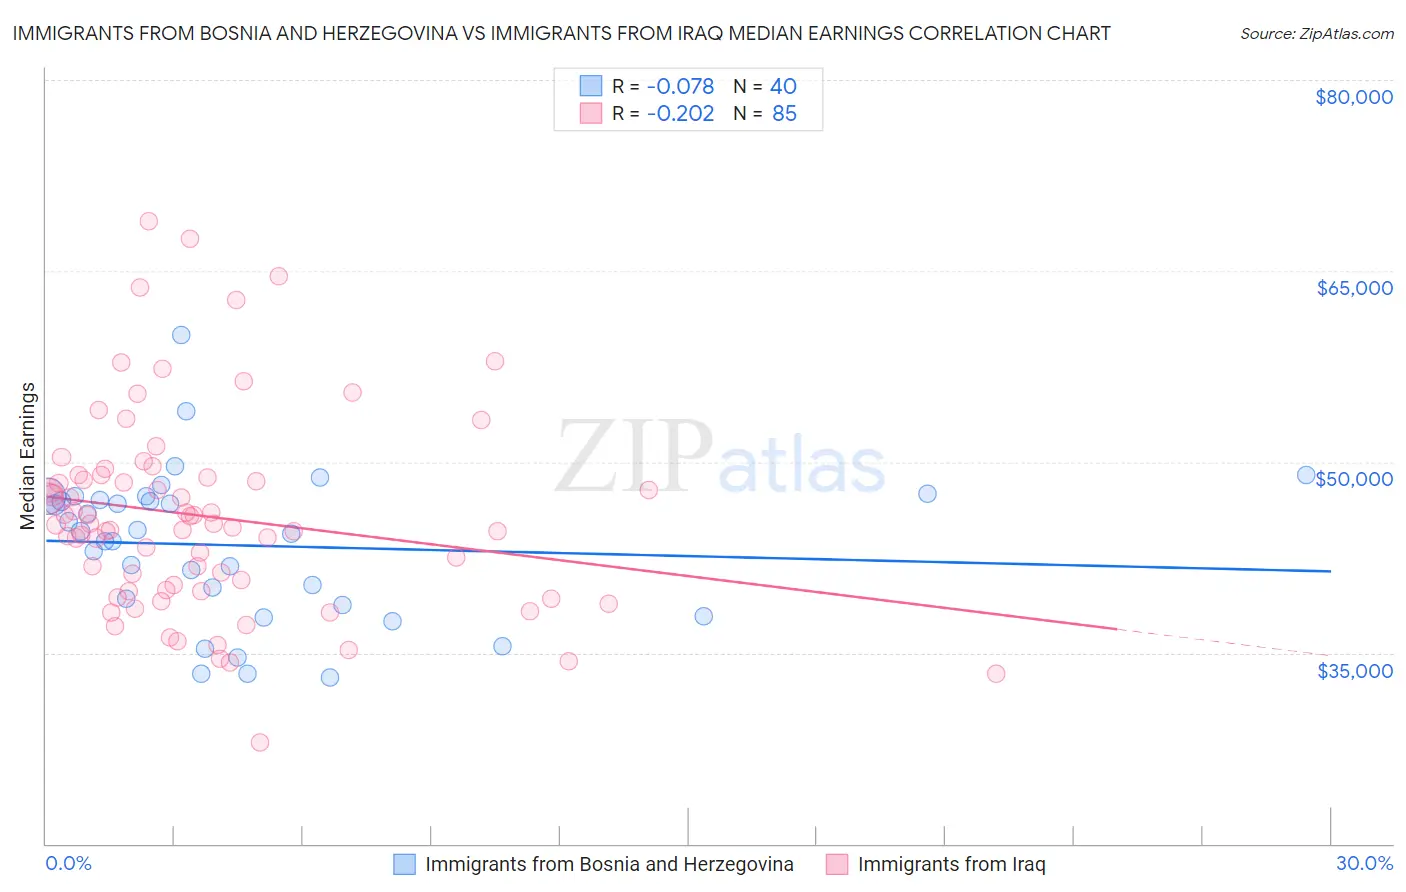
Immigrants from Bosnia and Herzegovina vs Immigrants from Iraq Median Earnings Correlation Chart
The statistical analysis conducted on geographies consisting of 156,807,140 people shows a slight negative correlation between the proportion of Immigrants from Bosnia and Herzegovina and median earnings in the United States with a correlation coefficient (R) of -0.078 and weighted average of $45,600. Similarly, the statistical analysis conducted on geographies consisting of 194,784,427 people shows a weak negative correlation between the proportion of Immigrants from Iraq and median earnings in the United States with a correlation coefficient (R) of -0.202 and weighted average of $44,988, a difference of 1.4%.
Median Earnings Correlation Summary
| Measurement | Immigrants from Bosnia and Herzegovina | Immigrants from Iraq |
| Minimum | $33,044 | $27,932 |
| Maximum | $59,938 | $68,937 |
| Range | $26,894 | $41,005 |
| Mean | $43,428 | $45,692 |
| Median | $44,487 | $45,037 |
| Interquartile 25% (IQ1) | $39,026 | $39,916 |
| Interquartile 75% (IQ3) | $47,127 | $48,838 |
| Interquartile Range (IQR) | $8,100 | $8,923 |
| Standard Deviation (Sample) | $5,836 | $7,829 |
| Standard Deviation (Population) | $5,763 | $7,782 |
Demographics Similar to Immigrants from Bosnia and Herzegovina and Immigrants from Iraq by Median Earnings
In terms of median earnings, the demographic groups most similar to Immigrants from Bosnia and Herzegovina are Immigrants from Thailand ($45,598, a difference of 0.0%), Immigrants from Grenada ($45,596, a difference of 0.010%), Panamanian ($45,593, a difference of 0.010%), Bermudan ($45,593, a difference of 0.010%), and Immigrants from Colombia ($45,550, a difference of 0.11%). Similarly, the demographic groups most similar to Immigrants from Iraq are Immigrants from Nigeria ($45,030, a difference of 0.090%), Native Hawaiian ($45,027, a difference of 0.090%), Immigrants from Cambodia ($45,090, a difference of 0.22%), West Indian ($45,132, a difference of 0.32%), and White/Caucasian ($45,197, a difference of 0.46%).
| Demographics | Rating | Rank | Median Earnings |
| Immigrants | Bosnia and Herzegovina | 23.7 /100 | #208 | Fair $45,600 |
| Immigrants | Thailand | 23.7 /100 | #209 | Fair $45,598 |
| Immigrants | Grenada | 23.6 /100 | #210 | Fair $45,596 |
| Panamanians | 23.5 /100 | #211 | Fair $45,593 |
| Bermudans | 23.5 /100 | #212 | Fair $45,593 |
| Immigrants | Colombia | 22.4 /100 | #213 | Fair $45,550 |
| Nigerians | 22.0 /100 | #214 | Fair $45,532 |
| Immigrants | Bangladesh | 22.0 /100 | #215 | Fair $45,532 |
| Guyanese | 20.6 /100 | #216 | Fair $45,470 |
| Tlingit-Haida | 20.5 /100 | #217 | Fair $45,468 |
| Spanish | 19.7 /100 | #218 | Poor $45,432 |
| Dutch | 18.4 /100 | #219 | Poor $45,370 |
| Ecuadorians | 15.3 /100 | #220 | Poor $45,214 |
| Immigrants | Guyana | 15.1 /100 | #221 | Poor $45,204 |
| Immigrants | Panama | 15.0 /100 | #222 | Poor $45,198 |
| Whites/Caucasians | 15.0 /100 | #223 | Poor $45,197 |
| West Indians | 13.9 /100 | #224 | Poor $45,132 |
| Immigrants | Cambodia | 13.2 /100 | #225 | Poor $45,090 |
| Immigrants | Nigeria | 12.2 /100 | #226 | Poor $45,030 |
| Native Hawaiians | 12.2 /100 | #227 | Poor $45,027 |
| Immigrants | Iraq | 11.6 /100 | #228 | Poor $44,988 |