Immigrants from Bosnia and Herzegovina vs Basque Householder Income Ages 25 - 44 years
COMPARE
Immigrants from Bosnia and Herzegovina
Basque
Householder Income Ages 25 - 44 years
Householder Income Ages 25 - 44 years Comparison
Immigrants from Bosnia and Herzegovina
Basques
$88,819
HOUSEHOLDER INCOME AGES 25 - 44 YEARS
4.0/ 100
METRIC RATING
228th/ 347
METRIC RANK
$96,709
HOUSEHOLDER INCOME AGES 25 - 44 YEARS
76.6/ 100
METRIC RATING
149th/ 347
METRIC RANK
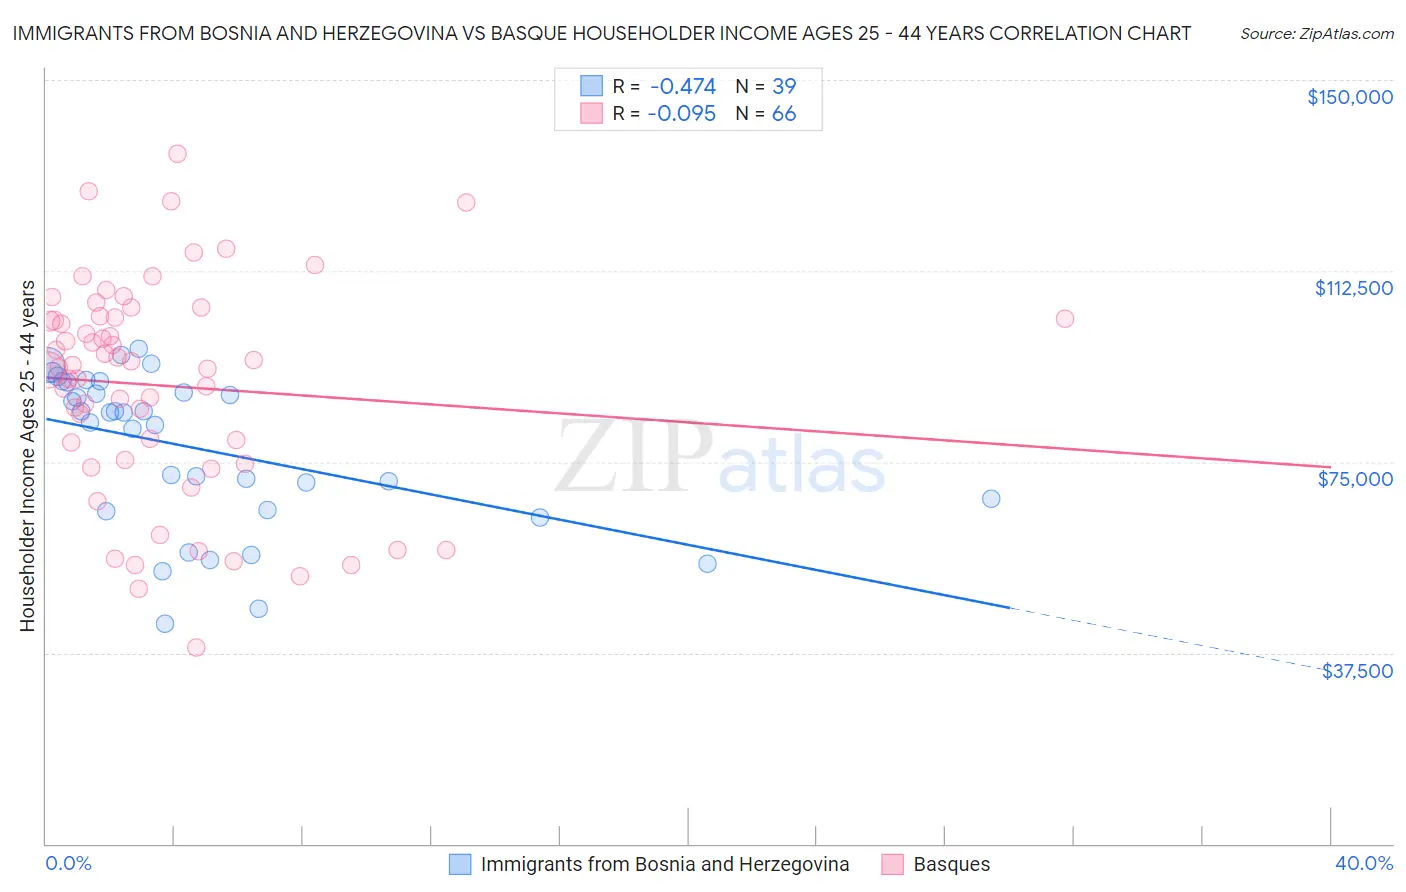
Immigrants from Bosnia and Herzegovina vs Basque Householder Income Ages 25 - 44 years Correlation Chart
The statistical analysis conducted on geographies consisting of 156,745,458 people shows a moderate negative correlation between the proportion of Immigrants from Bosnia and Herzegovina and household income with householder between the ages 25 and 44 in the United States with a correlation coefficient (R) of -0.474 and weighted average of $88,819. Similarly, the statistical analysis conducted on geographies consisting of 165,637,052 people shows a slight negative correlation between the proportion of Basques and household income with householder between the ages 25 and 44 in the United States with a correlation coefficient (R) of -0.095 and weighted average of $96,709, a difference of 8.9%.
Householder Income Ages 25 - 44 years Correlation Summary
| Measurement | Immigrants from Bosnia and Herzegovina | Basque |
| Minimum | $43,125 | $38,438 |
| Maximum | $97,331 | $135,625 |
| Range | $54,206 | $97,187 |
| Mean | $77,653 | $89,960 |
| Median | $84,682 | $93,797 |
| Interquartile 25% (IQ1) | $65,598 | $75,288 |
| Interquartile 75% (IQ3) | $90,547 | $103,321 |
| Interquartile Range (IQR) | $24,949 | $28,033 |
| Standard Deviation (Sample) | $15,061 | $21,216 |
| Standard Deviation (Population) | $14,867 | $21,055 |
Similar Demographics by Householder Income Ages 25 - 44 years
Demographics Similar to Immigrants from Bosnia and Herzegovina by Householder Income Ages 25 - 44 years
In terms of householder income ages 25 - 44 years, the demographic groups most similar to Immigrants from Bosnia and Herzegovina are Immigrants from St. Vincent and the Grenadines ($88,888, a difference of 0.080%), Immigrants from Barbados ($88,687, a difference of 0.15%), Alaskan Athabascan ($88,446, a difference of 0.42%), Immigrants from Grenada ($88,311, a difference of 0.58%), and Nonimmigrants ($88,301, a difference of 0.59%).
| Demographics | Rating | Rank | Householder Income Ages 25 - 44 years |
| Immigrants | Trinidad and Tobago | 6.5 /100 | #221 | Tragic $89,748 |
| Immigrants | Ecuador | 6.2 /100 | #222 | Tragic $89,673 |
| Immigrants | Guyana | 5.9 /100 | #223 | Tragic $89,586 |
| Barbadians | 5.9 /100 | #224 | Tragic $89,565 |
| Immigrants | Panama | 5.5 /100 | #225 | Tragic $89,451 |
| Immigrants | Iraq | 5.5 /100 | #226 | Tragic $89,444 |
| Immigrants | St. Vincent and the Grenadines | 4.1 /100 | #227 | Tragic $88,888 |
| Immigrants | Bosnia and Herzegovina | 4.0 /100 | #228 | Tragic $88,819 |
| Immigrants | Barbados | 3.7 /100 | #229 | Tragic $88,687 |
| Alaskan Athabascans | 3.3 /100 | #230 | Tragic $88,446 |
| Immigrants | Grenada | 3.0 /100 | #231 | Tragic $88,311 |
| Immigrants | Nonimmigrants | 3.0 /100 | #232 | Tragic $88,301 |
| Malaysians | 3.0 /100 | #233 | Tragic $88,291 |
| Venezuelans | 2.9 /100 | #234 | Tragic $88,232 |
| Bermudans | 2.9 /100 | #235 | Tragic $88,231 |
Demographics Similar to Basques by Householder Income Ages 25 - 44 years
In terms of householder income ages 25 - 44 years, the demographic groups most similar to Basques are Irish ($96,730, a difference of 0.020%), Ugandan ($96,667, a difference of 0.040%), Immigrants from Syria ($96,789, a difference of 0.080%), Ethiopian ($96,824, a difference of 0.12%), and Norwegian ($96,866, a difference of 0.16%).
| Demographics | Rating | Rank | Householder Income Ages 25 - 44 years |
| Danes | 81.3 /100 | #142 | Excellent $97,221 |
| Immigrants | Jordan | 81.0 /100 | #143 | Excellent $97,185 |
| Immigrants | Chile | 80.8 /100 | #144 | Excellent $97,159 |
| Norwegians | 78.2 /100 | #145 | Good $96,866 |
| Ethiopians | 77.8 /100 | #146 | Good $96,824 |
| Immigrants | Syria | 77.4 /100 | #147 | Good $96,789 |
| Irish | 76.9 /100 | #148 | Good $96,730 |
| Basques | 76.6 /100 | #149 | Good $96,709 |
| Ugandans | 76.2 /100 | #150 | Good $96,667 |
| Czechs | 74.8 /100 | #151 | Good $96,525 |
| South American Indians | 74.5 /100 | #152 | Good $96,497 |
| Slovenes | 73.9 /100 | #153 | Good $96,439 |
| Slavs | 73.2 /100 | #154 | Good $96,377 |
| Moroccans | 70.3 /100 | #155 | Good $96,117 |
| Immigrants | Germany | 67.9 /100 | #156 | Good $95,913 |