Immigrants from Bolivia vs Ghanaian Householder Income Over 65 years
COMPARE
Immigrants from Bolivia
Ghanaian
Householder Income Over 65 years
Householder Income Over 65 years Comparison
Immigrants from Bolivia
Ghanaians
$73,434
HOUSEHOLDER INCOME OVER 65 YEARS
100.0/ 100
METRIC RATING
7th/ 347
METRIC RANK
$60,043
HOUSEHOLDER INCOME OVER 65 YEARS
27.5/ 100
METRIC RATING
189th/ 347
METRIC RANK
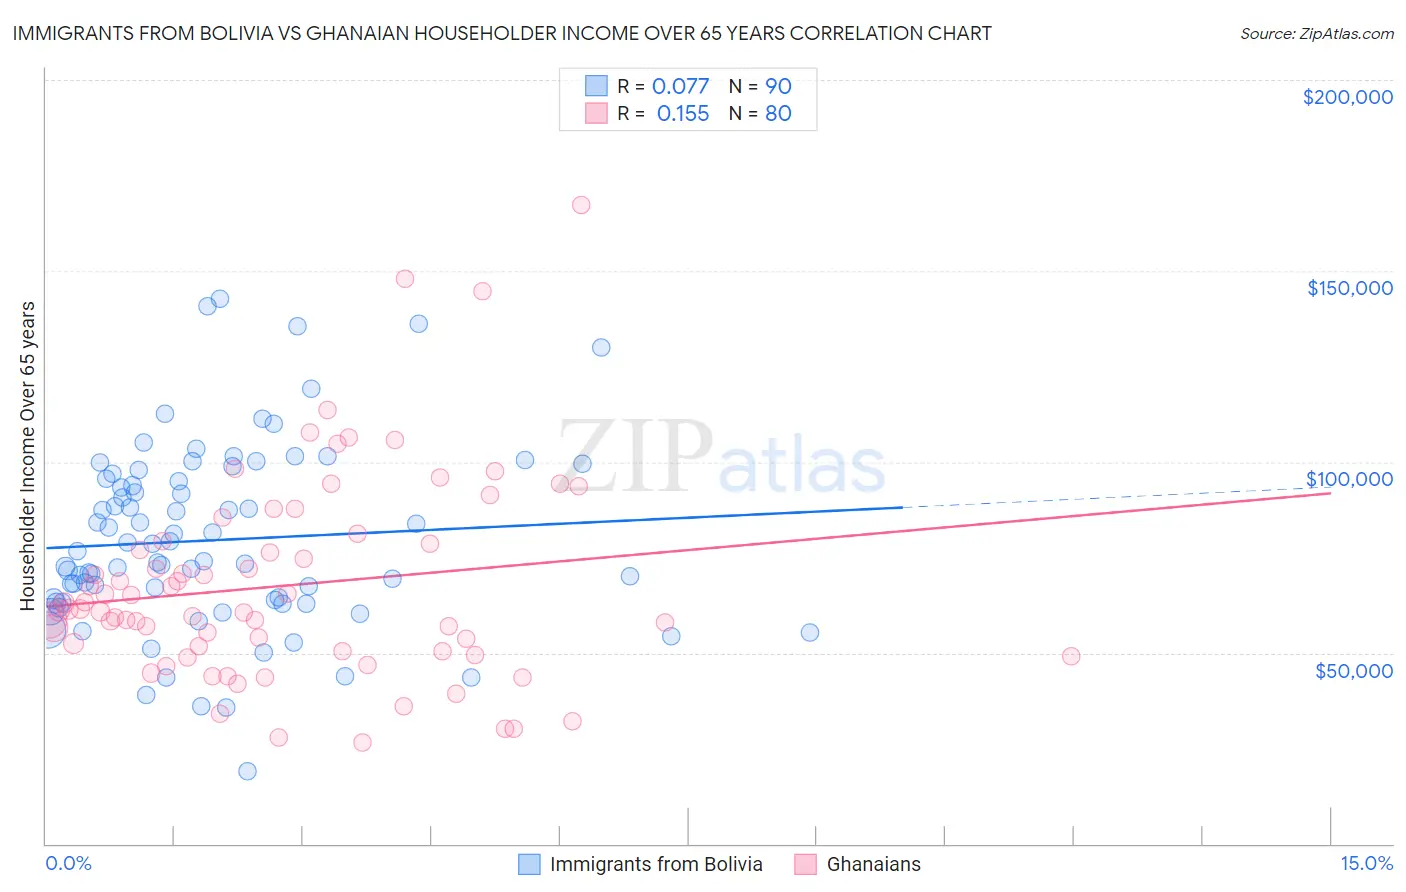
Immigrants from Bolivia vs Ghanaian Householder Income Over 65 years Correlation Chart
The statistical analysis conducted on geographies consisting of 158,593,749 people shows a slight positive correlation between the proportion of Immigrants from Bolivia and household income with householder over the age of 65 in the United States with a correlation coefficient (R) of 0.077 and weighted average of $73,434. Similarly, the statistical analysis conducted on geographies consisting of 190,075,998 people shows a poor positive correlation between the proportion of Ghanaians and household income with householder over the age of 65 in the United States with a correlation coefficient (R) of 0.155 and weighted average of $60,043, a difference of 22.3%.
Householder Income Over 65 years Correlation Summary
| Measurement | Immigrants from Bolivia | Ghanaian |
| Minimum | $19,148 | $26,429 |
| Maximum | $142,587 | $167,368 |
| Range | $123,439 | $140,939 |
| Mean | $79,510 | $67,634 |
| Median | $75,276 | $61,218 |
| Interquartile 25% (IQ1) | $63,072 | $50,453 |
| Interquartile 75% (IQ3) | $95,614 | $78,943 |
| Interquartile Range (IQR) | $32,542 | $28,490 |
| Standard Deviation (Sample) | $24,116 | $26,645 |
| Standard Deviation (Population) | $23,982 | $26,478 |
Similar Demographics by Householder Income Over 65 years
Demographics Similar to Immigrants from Bolivia by Householder Income Over 65 years
In terms of householder income over 65 years, the demographic groups most similar to Immigrants from Bolivia are Immigrants from Singapore ($72,963, a difference of 0.65%), Immigrants from India ($72,804, a difference of 0.87%), Bolivian ($74,245, a difference of 1.1%), Bhutanese ($72,288, a difference of 1.6%), and Thai ($72,099, a difference of 1.8%).
| Demographics | Rating | Rank | Householder Income Over 65 years |
| Chinese | 100.0 /100 | #1 | Exceptional $77,465 |
| Iranians | 100.0 /100 | #2 | Exceptional $77,429 |
| Immigrants | Taiwan | 100.0 /100 | #3 | Exceptional $77,051 |
| Filipinos | 100.0 /100 | #4 | Exceptional $76,686 |
| Immigrants | Iran | 100.0 /100 | #5 | Exceptional $75,081 |
| Bolivians | 100.0 /100 | #6 | Exceptional $74,245 |
| Immigrants | Bolivia | 100.0 /100 | #7 | Exceptional $73,434 |
| Immigrants | Singapore | 100.0 /100 | #8 | Exceptional $72,963 |
| Immigrants | India | 100.0 /100 | #9 | Exceptional $72,804 |
| Bhutanese | 100.0 /100 | #10 | Exceptional $72,288 |
| Thais | 100.0 /100 | #11 | Exceptional $72,099 |
| Cypriots | 100.0 /100 | #12 | Exceptional $71,714 |
| Immigrants | Hong Kong | 100.0 /100 | #13 | Exceptional $71,567 |
| Burmese | 100.0 /100 | #14 | Exceptional $71,139 |
| Native Hawaiians | 100.0 /100 | #15 | Exceptional $71,021 |
Demographics Similar to Ghanaians by Householder Income Over 65 years
In terms of householder income over 65 years, the demographic groups most similar to Ghanaians are Immigrants from Eritrea ($60,096, a difference of 0.090%), Puget Sound Salish ($59,934, a difference of 0.18%), Belgian ($59,915, a difference of 0.21%), Immigrants from Thailand ($60,217, a difference of 0.29%), and South American ($59,854, a difference of 0.32%).
| Demographics | Rating | Rank | Householder Income Over 65 years |
| Czechoslovakians | 40.0 /100 | #182 | Average $60,581 |
| Kenyans | 38.4 /100 | #183 | Fair $60,514 |
| Iraqis | 37.2 /100 | #184 | Fair $60,466 |
| Albanians | 32.0 /100 | #185 | Fair $60,249 |
| Slovenes | 31.8 /100 | #186 | Fair $60,241 |
| Immigrants | Thailand | 31.3 /100 | #187 | Fair $60,217 |
| Immigrants | Eritrea | 28.6 /100 | #188 | Fair $60,096 |
| Ghanaians | 27.5 /100 | #189 | Fair $60,043 |
| Puget Sound Salish | 25.3 /100 | #190 | Fair $59,934 |
| Belgians | 24.9 /100 | #191 | Fair $59,915 |
| South Americans | 23.8 /100 | #192 | Fair $59,854 |
| Immigrants | Costa Rica | 23.6 /100 | #193 | Fair $59,848 |
| Immigrants | Africa | 23.4 /100 | #194 | Fair $59,837 |
| Immigrants | Iraq | 23.2 /100 | #195 | Fair $59,824 |
| Germans | 21.5 /100 | #196 | Fair $59,730 |