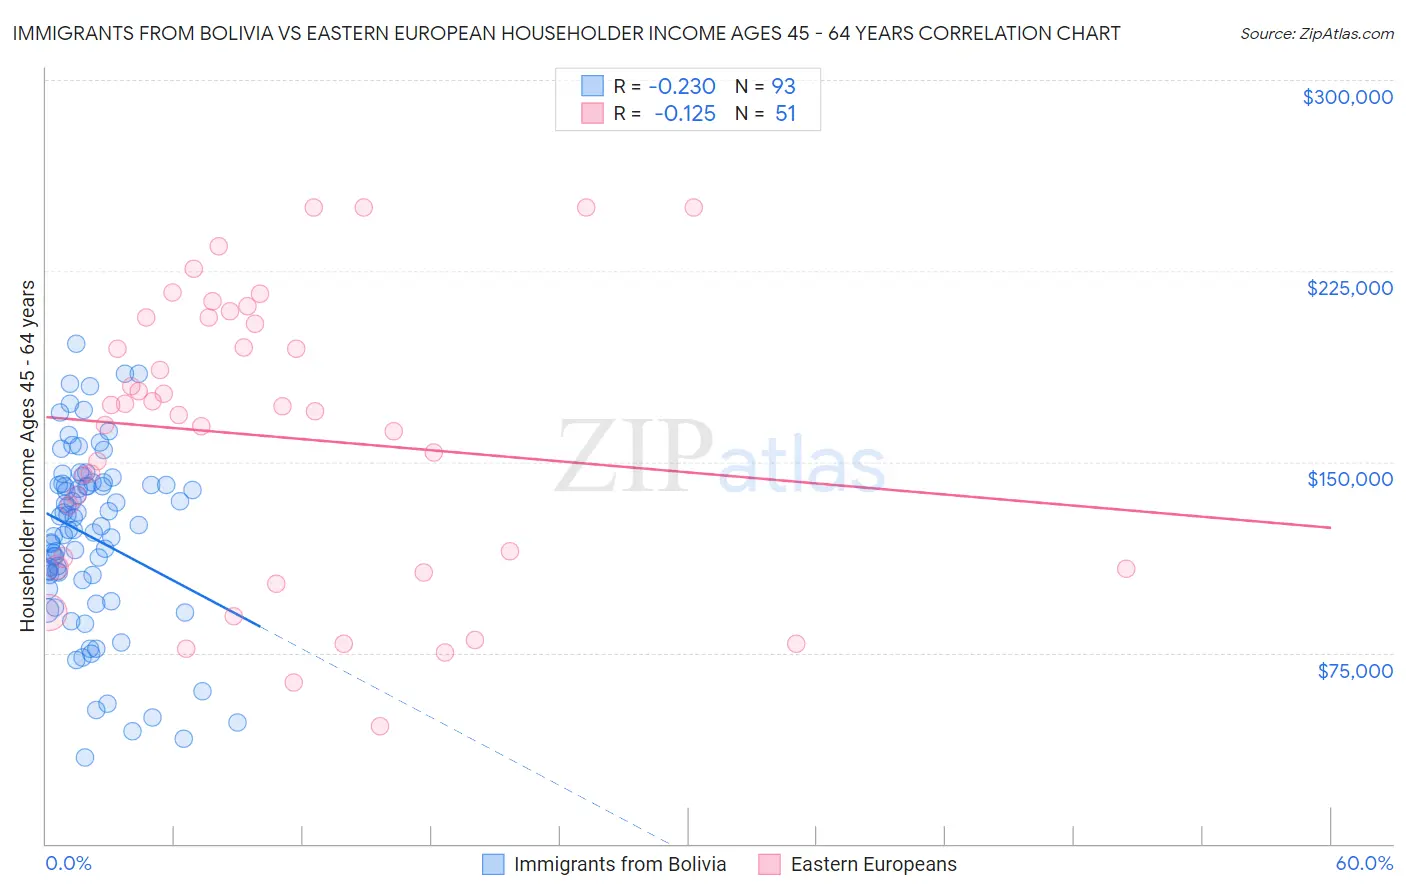
Immigrants from Bolivia vs Eastern European Householder Income Ages 45 - 64 years
COMPARE
Immigrants from Bolivia
Eastern European
Householder Income Ages 45 - 64 years
Householder Income Ages 45 - 64 years Comparison
Immigrants from Bolivia
Eastern Europeans
$117,731
HOUSEHOLDER INCOME AGES 45 - 64 YEARS
100.0/ 100
METRIC RATING
30th/ 347
METRIC RANK
$120,684
HOUSEHOLDER INCOME AGES 45 - 64 YEARS
100.0/ 100
METRIC RATING
19th/ 347
METRIC RANK
Immigrants from Bolivia vs Eastern European Householder Income Ages 45 - 64 years Correlation Chart
The statistical analysis conducted on geographies consisting of 158,694,143 people shows a weak negative correlation between the proportion of Immigrants from Bolivia and household income with householder between the ages 45 and 64 in the United States with a correlation coefficient (R) of -0.230 and weighted average of $117,731. Similarly, the statistical analysis conducted on geographies consisting of 460,234,248 people shows a poor negative correlation between the proportion of Eastern Europeans and household income with householder between the ages 45 and 64 in the United States with a correlation coefficient (R) of -0.125 and weighted average of $120,684, a difference of 2.5%.
Householder Income Ages 45 - 64 years Correlation Summary
| Measurement | Immigrants from Bolivia | Eastern European |
| Minimum | $33,906 | $46,087 |
| Maximum | $196,601 | $250,001 |
| Range | $162,695 | $203,914 |
| Mean | $120,740 | $160,074 |
| Median | $124,893 | $169,721 |
| Interquartile 25% (IQ1) | $104,523 | $108,414 |
| Interquartile 75% (IQ3) | $141,314 | $206,658 |
| Interquartile Range (IQR) | $36,791 | $98,244 |
| Standard Deviation (Sample) | $34,819 | $55,229 |
| Standard Deviation (Population) | $34,631 | $54,685 |
Demographics Similar to Immigrants from Bolivia and Eastern Europeans by Householder Income Ages 45 - 64 years
In terms of householder income ages 45 - 64 years, the demographic groups most similar to Immigrants from Bolivia are Bhutanese ($117,750, a difference of 0.020%), Turkish ($117,814, a difference of 0.070%), Immigrants from Northern Europe ($117,930, a difference of 0.17%), Immigrants from Sweden ($118,318, a difference of 0.50%), and Asian ($118,426, a difference of 0.59%). Similarly, the demographic groups most similar to Eastern Europeans are Immigrants from Korea ($121,243, a difference of 0.46%), Burmese ($121,444, a difference of 0.63%), Immigrants from Australia ($119,308, a difference of 1.1%), Immigrants from China ($122,178, a difference of 1.2%), and Immigrants from Eastern Asia ($122,222, a difference of 1.3%).
| Demographics | Rating | Rank | Householder Income Ages 45 - 64 years |
| Indians (Asian) | 100.0 /100 | #14 | Exceptional $122,343 |
| Immigrants | Eastern Asia | 100.0 /100 | #15 | Exceptional $122,222 |
| Immigrants | China | 100.0 /100 | #16 | Exceptional $122,178 |
| Burmese | 100.0 /100 | #17 | Exceptional $121,444 |
| Immigrants | Korea | 100.0 /100 | #18 | Exceptional $121,243 |
| Eastern Europeans | 100.0 /100 | #19 | Exceptional $120,684 |
| Immigrants | Australia | 100.0 /100 | #20 | Exceptional $119,308 |
| Immigrants | Sri Lanka | 100.0 /100 | #21 | Exceptional $119,094 |
| Immigrants | Belgium | 100.0 /100 | #22 | Exceptional $118,932 |
| Bolivians | 100.0 /100 | #23 | Exceptional $118,871 |
| Immigrants | Japan | 100.0 /100 | #24 | Exceptional $118,498 |
| Asians | 100.0 /100 | #25 | Exceptional $118,426 |
| Immigrants | Sweden | 100.0 /100 | #26 | Exceptional $118,318 |
| Immigrants | Northern Europe | 100.0 /100 | #27 | Exceptional $117,930 |
| Turks | 100.0 /100 | #28 | Exceptional $117,814 |
| Bhutanese | 100.0 /100 | #29 | Exceptional $117,750 |
| Immigrants | Bolivia | 100.0 /100 | #30 | Exceptional $117,731 |
| Immigrants | Asia | 100.0 /100 | #31 | Exceptional $116,566 |
| Russians | 100.0 /100 | #32 | Exceptional $116,328 |
| Chinese | 100.0 /100 | #33 | Exceptional $116,156 |
| Immigrants | Denmark | 100.0 /100 | #34 | Exceptional $116,000 |