Immigrants from Bolivia vs African Householder Income Ages 25 - 44 years
COMPARE
Immigrants from Bolivia
African
Householder Income Ages 25 - 44 years
Householder Income Ages 25 - 44 years Comparison
Immigrants from Bolivia
Africans
$108,128
HOUSEHOLDER INCOME AGES 25 - 44 YEARS
99.9/ 100
METRIC RATING
41st/ 347
METRIC RANK
$78,986
HOUSEHOLDER INCOME AGES 25 - 44 YEARS
0.0/ 100
METRIC RATING
316th/ 347
METRIC RANK
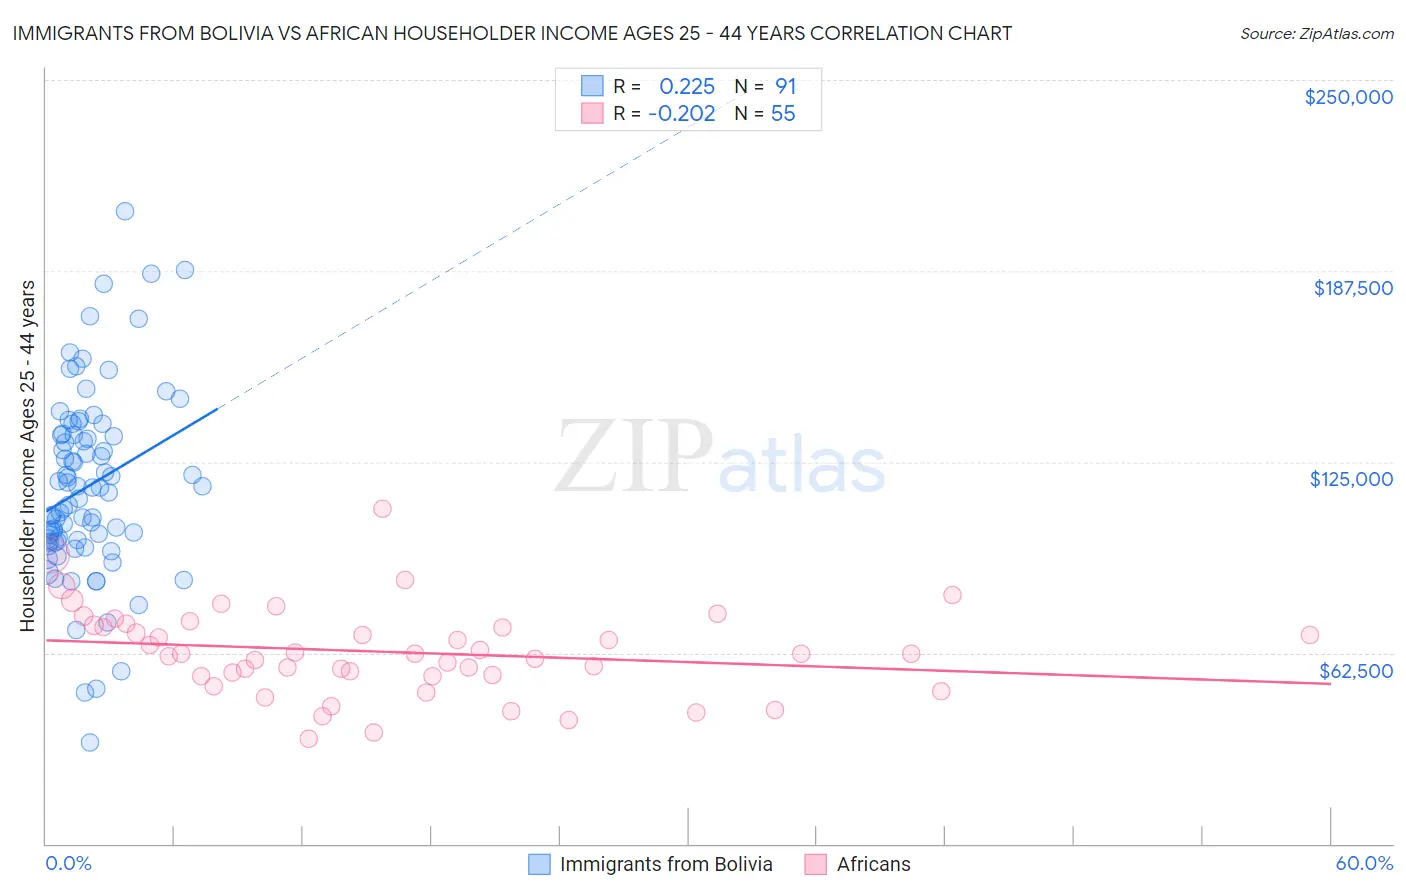
Immigrants from Bolivia vs African Householder Income Ages 25 - 44 years Correlation Chart
The statistical analysis conducted on geographies consisting of 158,645,666 people shows a weak positive correlation between the proportion of Immigrants from Bolivia and household income with householder between the ages 25 and 44 in the United States with a correlation coefficient (R) of 0.225 and weighted average of $108,128. Similarly, the statistical analysis conducted on geographies consisting of 468,079,213 people shows a weak negative correlation between the proportion of Africans and household income with householder between the ages 25 and 44 in the United States with a correlation coefficient (R) of -0.202 and weighted average of $78,986, a difference of 36.9%.
Householder Income Ages 25 - 44 years Correlation Summary
| Measurement | Immigrants from Bolivia | African |
| Minimum | $33,063 | $34,242 |
| Maximum | $207,065 | $109,792 |
| Range | $174,002 | $75,550 |
| Mean | $117,009 | $62,789 |
| Median | $116,442 | $62,232 |
| Interquartile 25% (IQ1) | $98,830 | $54,869 |
| Interquartile 75% (IQ3) | $133,840 | $71,404 |
| Interquartile Range (IQR) | $35,009 | $16,535 |
| Standard Deviation (Sample) | $30,560 | $14,499 |
| Standard Deviation (Population) | $30,391 | $14,367 |
Similar Demographics by Householder Income Ages 25 - 44 years
Demographics Similar to Immigrants from Bolivia by Householder Income Ages 25 - 44 years
In terms of householder income ages 25 - 44 years, the demographic groups most similar to Immigrants from Bolivia are Immigrants from Lithuania ($108,149, a difference of 0.020%), Immigrants from France ($108,257, a difference of 0.12%), Australian ($107,912, a difference of 0.20%), Soviet Union ($108,457, a difference of 0.30%), and Immigrants from Malaysia ($107,650, a difference of 0.44%).
| Demographics | Rating | Rank | Householder Income Ages 25 - 44 years |
| Bolivians | 100.0 /100 | #34 | Exceptional $109,372 |
| Immigrants | Switzerland | 100.0 /100 | #35 | Exceptional $109,185 |
| Latvians | 100.0 /100 | #36 | Exceptional $108,926 |
| Immigrants | Russia | 100.0 /100 | #37 | Exceptional $108,751 |
| Soviet Union | 100.0 /100 | #38 | Exceptional $108,457 |
| Immigrants | France | 99.9 /100 | #39 | Exceptional $108,257 |
| Immigrants | Lithuania | 99.9 /100 | #40 | Exceptional $108,149 |
| Immigrants | Bolivia | 99.9 /100 | #41 | Exceptional $108,128 |
| Australians | 99.9 /100 | #42 | Exceptional $107,912 |
| Immigrants | Malaysia | 99.9 /100 | #43 | Exceptional $107,650 |
| Immigrants | Indonesia | 99.9 /100 | #44 | Exceptional $107,627 |
| Israelis | 99.9 /100 | #45 | Exceptional $107,579 |
| Immigrants | Belarus | 99.9 /100 | #46 | Exceptional $107,393 |
| Estonians | 99.9 /100 | #47 | Exceptional $107,269 |
| Bulgarians | 99.9 /100 | #48 | Exceptional $107,264 |
Demographics Similar to Africans by Householder Income Ages 25 - 44 years
In terms of householder income ages 25 - 44 years, the demographic groups most similar to Africans are Ottawa ($79,012, a difference of 0.030%), U.S. Virgin Islander ($78,911, a difference of 0.090%), Cheyenne ($79,152, a difference of 0.21%), Immigrants from Mexico ($78,809, a difference of 0.22%), and Menominee ($79,358, a difference of 0.47%).
| Demographics | Rating | Rank | Householder Income Ages 25 - 44 years |
| Chippewa | 0.0 /100 | #309 | Tragic $80,005 |
| Fijians | 0.0 /100 | #310 | Tragic $79,956 |
| Indonesians | 0.0 /100 | #311 | Tragic $79,543 |
| Immigrants | Haiti | 0.0 /100 | #312 | Tragic $79,391 |
| Menominee | 0.0 /100 | #313 | Tragic $79,358 |
| Cheyenne | 0.0 /100 | #314 | Tragic $79,152 |
| Ottawa | 0.0 /100 | #315 | Tragic $79,012 |
| Africans | 0.0 /100 | #316 | Tragic $78,986 |
| U.S. Virgin Islanders | 0.0 /100 | #317 | Tragic $78,911 |
| Immigrants | Mexico | 0.0 /100 | #318 | Tragic $78,809 |
| Hondurans | 0.0 /100 | #319 | Tragic $78,540 |
| Choctaw | 0.0 /100 | #320 | Tragic $78,168 |
| Immigrants | Zaire | 0.0 /100 | #321 | Tragic $78,045 |
| Chickasaw | 0.0 /100 | #322 | Tragic $77,929 |
| Immigrants | Honduras | 0.0 /100 | #323 | Tragic $77,328 |