Immigrants from Belize vs Slovene Householder Income Ages 45 - 64 years
COMPARE
Immigrants from Belize
Slovene
Householder Income Ages 45 - 64 years
Householder Income Ages 45 - 64 years Comparison
Immigrants from Belize
Slovenes
$87,229
HOUSEHOLDER INCOME AGES 45 - 64 YEARS
0.1/ 100
METRIC RATING
275th/ 347
METRIC RANK
$102,885
HOUSEHOLDER INCOME AGES 45 - 64 YEARS
78.3/ 100
METRIC RATING
154th/ 347
METRIC RANK
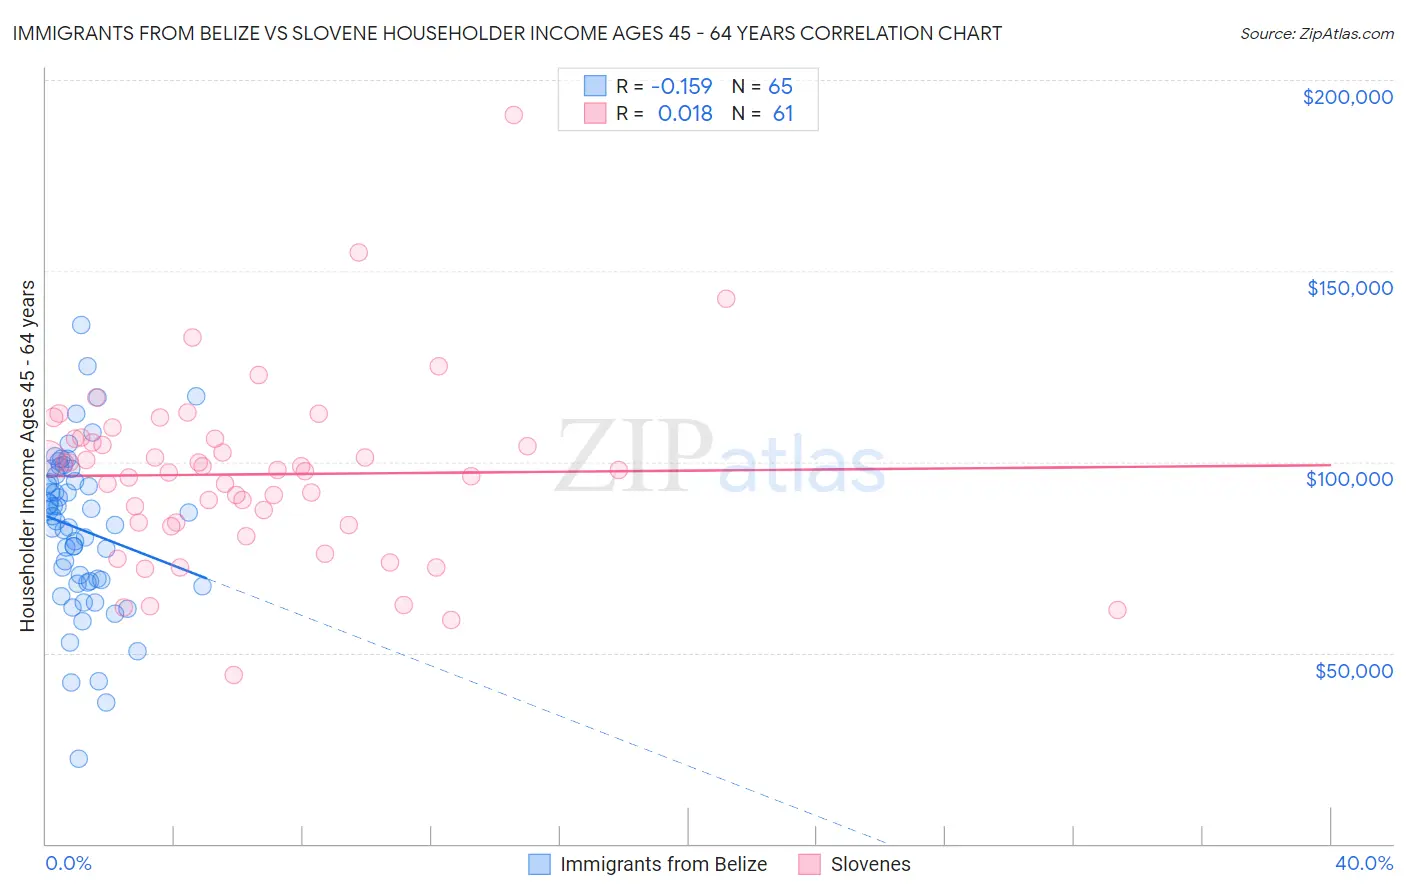
Immigrants from Belize vs Slovene Householder Income Ages 45 - 64 years Correlation Chart
The statistical analysis conducted on geographies consisting of 130,242,241 people shows a poor negative correlation between the proportion of Immigrants from Belize and household income with householder between the ages 45 and 64 in the United States with a correlation coefficient (R) of -0.159 and weighted average of $87,229. Similarly, the statistical analysis conducted on geographies consisting of 261,090,086 people shows no correlation between the proportion of Slovenes and household income with householder between the ages 45 and 64 in the United States with a correlation coefficient (R) of 0.018 and weighted average of $102,885, a difference of 17.9%.
Householder Income Ages 45 - 64 years Correlation Summary
| Measurement | Immigrants from Belize | Slovene |
| Minimum | $22,213 | $44,107 |
| Maximum | $135,848 | $190,938 |
| Range | $113,635 | $146,831 |
| Mean | $82,353 | $96,740 |
| Median | $84,313 | $97,917 |
| Interquartile 25% (IQ1) | $68,610 | $83,761 |
| Interquartile 75% (IQ3) | $95,695 | $106,022 |
| Interquartile Range (IQR) | $27,084 | $22,261 |
| Standard Deviation (Sample) | $20,996 | $23,476 |
| Standard Deviation (Population) | $20,834 | $23,282 |
Similar Demographics by Householder Income Ages 45 - 64 years
Demographics Similar to Immigrants from Belize by Householder Income Ages 45 - 64 years
In terms of householder income ages 45 - 64 years, the demographic groups most similar to Immigrants from Belize are Immigrants from Latin America ($87,219, a difference of 0.010%), Iroquois ($87,255, a difference of 0.030%), Cree ($87,185, a difference of 0.050%), Immigrants from Jamaica ($87,035, a difference of 0.22%), and Yakama ($86,992, a difference of 0.27%).
| Demographics | Rating | Rank | Householder Income Ages 45 - 64 years |
| Immigrants | Micronesia | 0.2 /100 | #268 | Tragic $87,864 |
| Spanish Americans | 0.2 /100 | #269 | Tragic $87,836 |
| Immigrants | Liberia | 0.2 /100 | #270 | Tragic $87,739 |
| Guatemalans | 0.2 /100 | #271 | Tragic $87,705 |
| Cape Verdeans | 0.2 /100 | #272 | Tragic $87,580 |
| Spanish American Indians | 0.2 /100 | #273 | Tragic $87,561 |
| Iroquois | 0.1 /100 | #274 | Tragic $87,255 |
| Immigrants | Belize | 0.1 /100 | #275 | Tragic $87,229 |
| Immigrants | Latin America | 0.1 /100 | #276 | Tragic $87,219 |
| Cree | 0.1 /100 | #277 | Tragic $87,185 |
| Immigrants | Jamaica | 0.1 /100 | #278 | Tragic $87,035 |
| Yakama | 0.1 /100 | #279 | Tragic $86,992 |
| Immigrants | Somalia | 0.1 /100 | #280 | Tragic $86,987 |
| Yaqui | 0.1 /100 | #281 | Tragic $86,914 |
| Senegalese | 0.1 /100 | #282 | Tragic $86,897 |
Demographics Similar to Slovenes by Householder Income Ages 45 - 64 years
In terms of householder income ages 45 - 64 years, the demographic groups most similar to Slovenes are Scandinavian ($102,969, a difference of 0.080%), Costa Rican ($102,779, a difference of 0.10%), Carpatho Rusyn ($102,777, a difference of 0.11%), Immigrants from Ethiopia ($102,763, a difference of 0.12%), and Swiss ($103,071, a difference of 0.18%).
| Demographics | Rating | Rank | Householder Income Ages 45 - 64 years |
| Basques | 82.3 /100 | #147 | Excellent $103,387 |
| Immigrants | Germany | 81.5 /100 | #148 | Excellent $103,282 |
| Immigrants | Sierra Leone | 81.1 /100 | #149 | Excellent $103,227 |
| Immigrants | Peru | 80.7 /100 | #150 | Excellent $103,173 |
| Swiss | 79.9 /100 | #151 | Good $103,071 |
| Irish | 79.8 /100 | #152 | Good $103,067 |
| Scandinavians | 79.0 /100 | #153 | Good $102,969 |
| Slovenes | 78.3 /100 | #154 | Good $102,885 |
| Costa Ricans | 77.4 /100 | #155 | Good $102,779 |
| Carpatho Rusyns | 77.4 /100 | #156 | Good $102,777 |
| Immigrants | Ethiopia | 77.3 /100 | #157 | Good $102,763 |
| Slavs | 76.1 /100 | #158 | Good $102,629 |
| Sierra Leoneans | 74.2 /100 | #159 | Good $102,427 |
| Icelanders | 72.5 /100 | #160 | Good $102,261 |
| Immigrants | Nepal | 71.8 /100 | #161 | Good $102,190 |