Immigrants from Belgium vs Colville Householder Income Ages 45 - 64 years
COMPARE
Immigrants from Belgium
Colville
Householder Income Ages 45 - 64 years
Householder Income Ages 45 - 64 years Comparison
Immigrants from Belgium
Colville
$118,932
HOUSEHOLDER INCOME AGES 45 - 64 YEARS
100.0/ 100
METRIC RATING
22nd/ 347
METRIC RANK
$82,474
HOUSEHOLDER INCOME AGES 45 - 64 YEARS
0.0/ 100
METRIC RATING
317th/ 347
METRIC RANK
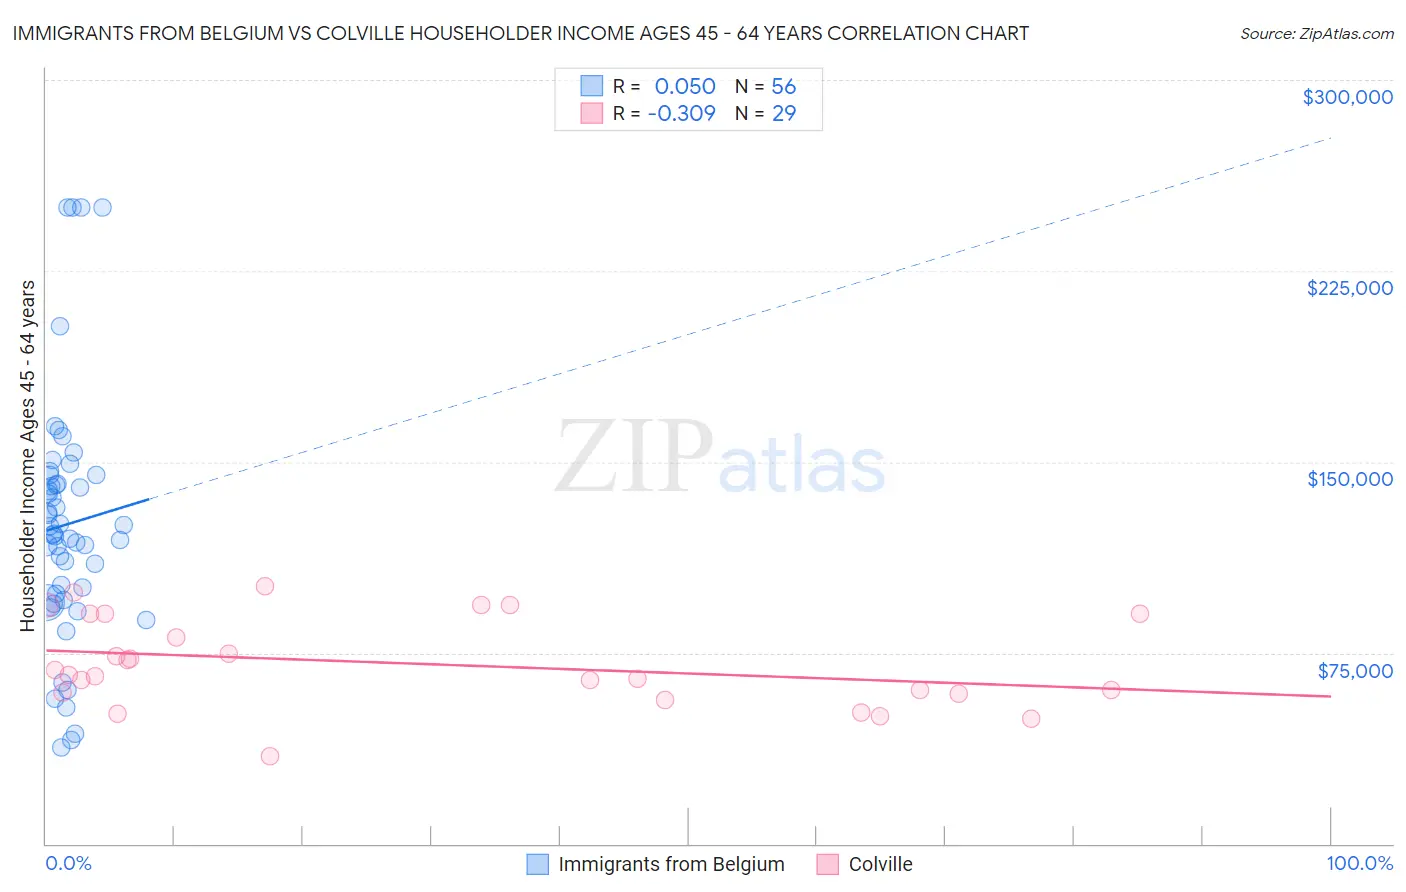
Immigrants from Belgium vs Colville Householder Income Ages 45 - 64 years Correlation Chart
The statistical analysis conducted on geographies consisting of 146,611,057 people shows a slight positive correlation between the proportion of Immigrants from Belgium and household income with householder between the ages 45 and 64 in the United States with a correlation coefficient (R) of 0.050 and weighted average of $118,932. Similarly, the statistical analysis conducted on geographies consisting of 34,670,712 people shows a mild negative correlation between the proportion of Colville and household income with householder between the ages 45 and 64 in the United States with a correlation coefficient (R) of -0.309 and weighted average of $82,474, a difference of 44.2%.
Householder Income Ages 45 - 64 years Correlation Summary
| Measurement | Immigrants from Belgium | Colville |
| Minimum | $38,026 | $34,612 |
| Maximum | $250,001 | $101,250 |
| Range | $211,975 | $66,638 |
| Mean | $125,440 | $70,774 |
| Median | $121,589 | $66,115 |
| Interquartile 25% (IQ1) | $96,886 | $59,200 |
| Interquartile 75% (IQ3) | $142,973 | $90,249 |
| Interquartile Range (IQR) | $46,087 | $31,049 |
| Standard Deviation (Sample) | $48,145 | $17,280 |
| Standard Deviation (Population) | $47,713 | $16,979 |
Similar Demographics by Householder Income Ages 45 - 64 years
Demographics Similar to Immigrants from Belgium by Householder Income Ages 45 - 64 years
In terms of householder income ages 45 - 64 years, the demographic groups most similar to Immigrants from Belgium are Bolivian ($118,871, a difference of 0.050%), Immigrants from Sri Lanka ($119,094, a difference of 0.14%), Immigrants from Australia ($119,308, a difference of 0.32%), Immigrants from Japan ($118,498, a difference of 0.37%), and Asian ($118,426, a difference of 0.43%).
| Demographics | Rating | Rank | Householder Income Ages 45 - 64 years |
| Immigrants | Eastern Asia | 100.0 /100 | #15 | Exceptional $122,222 |
| Immigrants | China | 100.0 /100 | #16 | Exceptional $122,178 |
| Burmese | 100.0 /100 | #17 | Exceptional $121,444 |
| Immigrants | Korea | 100.0 /100 | #18 | Exceptional $121,243 |
| Eastern Europeans | 100.0 /100 | #19 | Exceptional $120,684 |
| Immigrants | Australia | 100.0 /100 | #20 | Exceptional $119,308 |
| Immigrants | Sri Lanka | 100.0 /100 | #21 | Exceptional $119,094 |
| Immigrants | Belgium | 100.0 /100 | #22 | Exceptional $118,932 |
| Bolivians | 100.0 /100 | #23 | Exceptional $118,871 |
| Immigrants | Japan | 100.0 /100 | #24 | Exceptional $118,498 |
| Asians | 100.0 /100 | #25 | Exceptional $118,426 |
| Immigrants | Sweden | 100.0 /100 | #26 | Exceptional $118,318 |
| Immigrants | Northern Europe | 100.0 /100 | #27 | Exceptional $117,930 |
| Turks | 100.0 /100 | #28 | Exceptional $117,814 |
| Bhutanese | 100.0 /100 | #29 | Exceptional $117,750 |
Demographics Similar to Colville by Householder Income Ages 45 - 64 years
In terms of householder income ages 45 - 64 years, the demographic groups most similar to Colville are Immigrants from Caribbean ($82,513, a difference of 0.050%), Paiute ($82,629, a difference of 0.19%), Choctaw ($82,287, a difference of 0.23%), Immigrants from Honduras ($82,697, a difference of 0.27%), and U.S. Virgin Islander ($82,736, a difference of 0.32%).
| Demographics | Rating | Rank | Householder Income Ages 45 - 64 years |
| Immigrants | Haiti | 0.0 /100 | #310 | Tragic $83,257 |
| Immigrants | Bahamas | 0.0 /100 | #311 | Tragic $83,177 |
| Cajuns | 0.0 /100 | #312 | Tragic $83,015 |
| U.S. Virgin Islanders | 0.0 /100 | #313 | Tragic $82,736 |
| Immigrants | Honduras | 0.0 /100 | #314 | Tragic $82,697 |
| Paiute | 0.0 /100 | #315 | Tragic $82,629 |
| Immigrants | Caribbean | 0.0 /100 | #316 | Tragic $82,513 |
| Colville | 0.0 /100 | #317 | Tragic $82,474 |
| Choctaw | 0.0 /100 | #318 | Tragic $82,287 |
| Chickasaw | 0.0 /100 | #319 | Tragic $82,193 |
| Apache | 0.0 /100 | #320 | Tragic $82,184 |
| Yuman | 0.0 /100 | #321 | Tragic $82,139 |
| Sioux | 0.0 /100 | #322 | Tragic $81,750 |
| Bahamians | 0.0 /100 | #323 | Tragic $81,369 |
| Yup'ik | 0.0 /100 | #324 | Tragic $81,000 |