Immigrants from Bangladesh vs Yup'ik Median Earnings
COMPARE
Immigrants from Bangladesh
Yup'ik
Median Earnings
Median Earnings Comparison
Immigrants from Bangladesh
Yup'ik
$45,532
MEDIAN EARNINGS
22.0/ 100
METRIC RATING
215th/ 347
METRIC RANK
$35,942
MEDIAN EARNINGS
0.0/ 100
METRIC RATING
346th/ 347
METRIC RANK
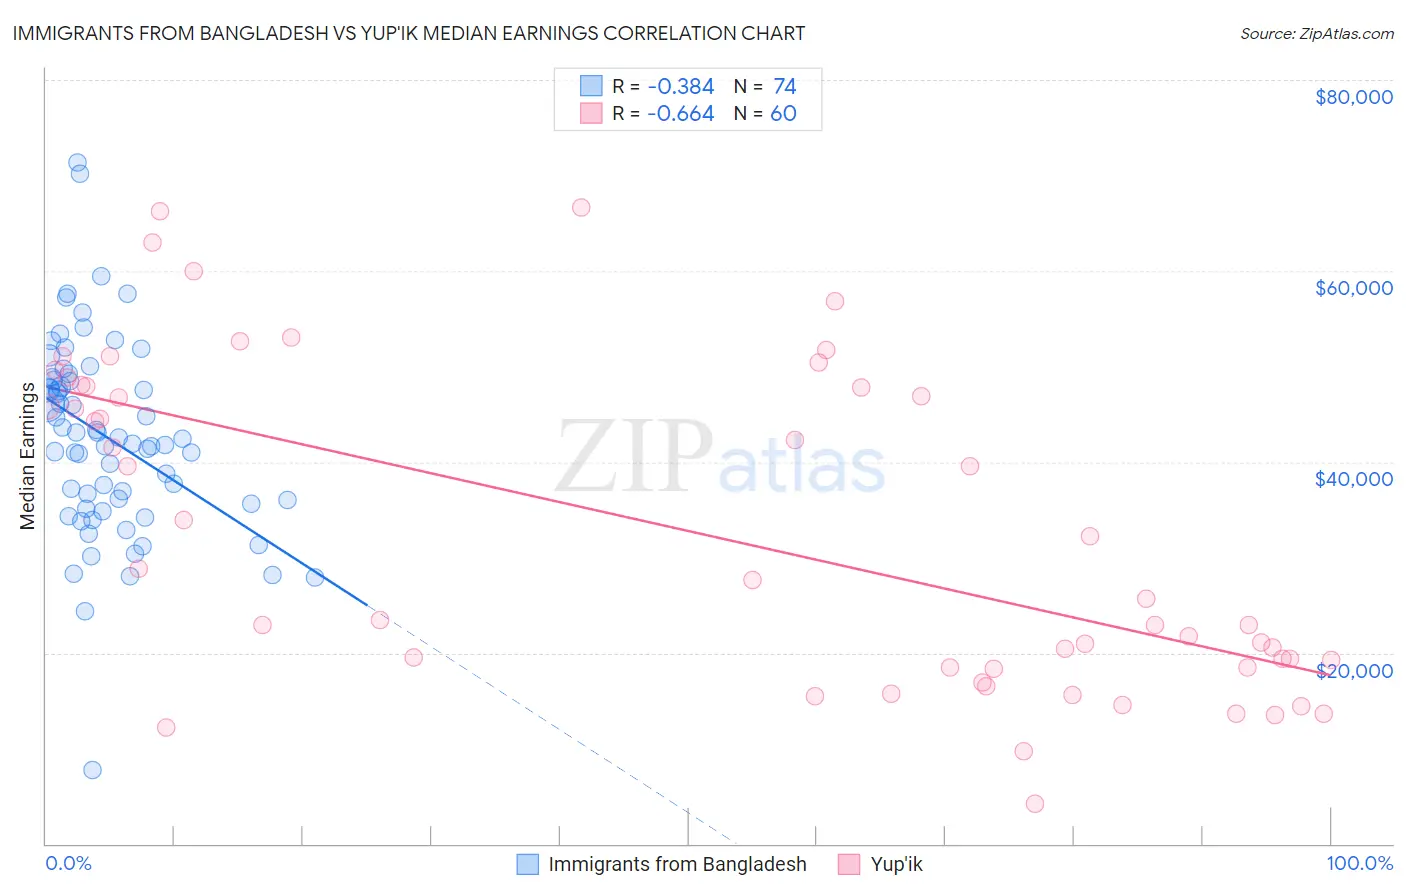
Immigrants from Bangladesh vs Yup'ik Median Earnings Correlation Chart
The statistical analysis conducted on geographies consisting of 203,670,623 people shows a mild negative correlation between the proportion of Immigrants from Bangladesh and median earnings in the United States with a correlation coefficient (R) of -0.384 and weighted average of $45,532. Similarly, the statistical analysis conducted on geographies consisting of 39,954,452 people shows a significant negative correlation between the proportion of Yup'ik and median earnings in the United States with a correlation coefficient (R) of -0.664 and weighted average of $35,942, a difference of 26.7%.
Median Earnings Correlation Summary
| Measurement | Immigrants from Bangladesh | Yup'ik |
| Minimum | $7,703 | $4,192 |
| Maximum | $71,366 | $66,667 |
| Range | $63,663 | $62,475 |
| Mean | $42,517 | $32,584 |
| Median | $42,193 | $26,644 |
| Interquartile 25% (IQ1) | $35,657 | $18,448 |
| Interquartile 75% (IQ3) | $48,515 | $47,862 |
| Interquartile Range (IQR) | $12,858 | $29,414 |
| Standard Deviation (Sample) | $10,295 | $16,777 |
| Standard Deviation (Population) | $10,225 | $16,637 |
Similar Demographics by Median Earnings
Demographics Similar to Immigrants from Bangladesh by Median Earnings
In terms of median earnings, the demographic groups most similar to Immigrants from Bangladesh are Nigerian ($45,532, a difference of 0.0%), Immigrants from Colombia ($45,550, a difference of 0.040%), Panamanian ($45,593, a difference of 0.13%), Bermudan ($45,593, a difference of 0.13%), and Immigrants from Grenada ($45,596, a difference of 0.14%).
| Demographics | Rating | Rank | Median Earnings |
| Immigrants | Bosnia and Herzegovina | 23.7 /100 | #208 | Fair $45,600 |
| Immigrants | Thailand | 23.7 /100 | #209 | Fair $45,598 |
| Immigrants | Grenada | 23.6 /100 | #210 | Fair $45,596 |
| Panamanians | 23.5 /100 | #211 | Fair $45,593 |
| Bermudans | 23.5 /100 | #212 | Fair $45,593 |
| Immigrants | Colombia | 22.4 /100 | #213 | Fair $45,550 |
| Nigerians | 22.0 /100 | #214 | Fair $45,532 |
| Immigrants | Bangladesh | 22.0 /100 | #215 | Fair $45,532 |
| Guyanese | 20.6 /100 | #216 | Fair $45,470 |
| Tlingit-Haida | 20.5 /100 | #217 | Fair $45,468 |
| Spanish | 19.7 /100 | #218 | Poor $45,432 |
| Dutch | 18.4 /100 | #219 | Poor $45,370 |
| Ecuadorians | 15.3 /100 | #220 | Poor $45,214 |
| Immigrants | Guyana | 15.1 /100 | #221 | Poor $45,204 |
| Immigrants | Panama | 15.0 /100 | #222 | Poor $45,198 |
Demographics Similar to Yup'ik by Median Earnings
In terms of median earnings, the demographic groups most similar to Yup'ik are Puerto Rican ($35,560, a difference of 1.1%), Tohono O'odham ($36,349, a difference of 1.1%), Arapaho ($36,586, a difference of 1.8%), Pueblo ($36,859, a difference of 2.5%), and Hopi ($36,871, a difference of 2.6%).
| Demographics | Rating | Rank | Median Earnings |
| Houma | 0.0 /100 | #333 | Tragic $38,949 |
| Spanish American Indians | 0.0 /100 | #334 | Tragic $38,907 |
| Natives/Alaskans | 0.0 /100 | #335 | Tragic $38,896 |
| Crow | 0.0 /100 | #336 | Tragic $38,707 |
| Immigrants | Cuba | 0.0 /100 | #337 | Tragic $38,426 |
| Pima | 0.0 /100 | #338 | Tragic $38,285 |
| Menominee | 0.0 /100 | #339 | Tragic $37,884 |
| Navajo | 0.0 /100 | #340 | Tragic $36,999 |
| Lumbee | 0.0 /100 | #341 | Tragic $36,876 |
| Hopi | 0.0 /100 | #342 | Tragic $36,871 |
| Pueblo | 0.0 /100 | #343 | Tragic $36,859 |
| Arapaho | 0.0 /100 | #344 | Tragic $36,586 |
| Tohono O'odham | 0.0 /100 | #345 | Tragic $36,349 |
| Yup'ik | 0.0 /100 | #346 | Tragic $35,942 |
| Puerto Ricans | 0.0 /100 | #347 | Tragic $35,560 |