Immigrants from Bangladesh vs Delaware Median Household Income
COMPARE
Immigrants from Bangladesh
Delaware
Median Household Income
Median Household Income Comparison
Immigrants from Bangladesh
Delaware
$80,722
MEDIAN HOUSEHOLD INCOME
5.7/ 100
METRIC RATING
228th/ 347
METRIC RANK
$80,527
MEDIAN HOUSEHOLD INCOME
5.0/ 100
METRIC RATING
229th/ 347
METRIC RANK
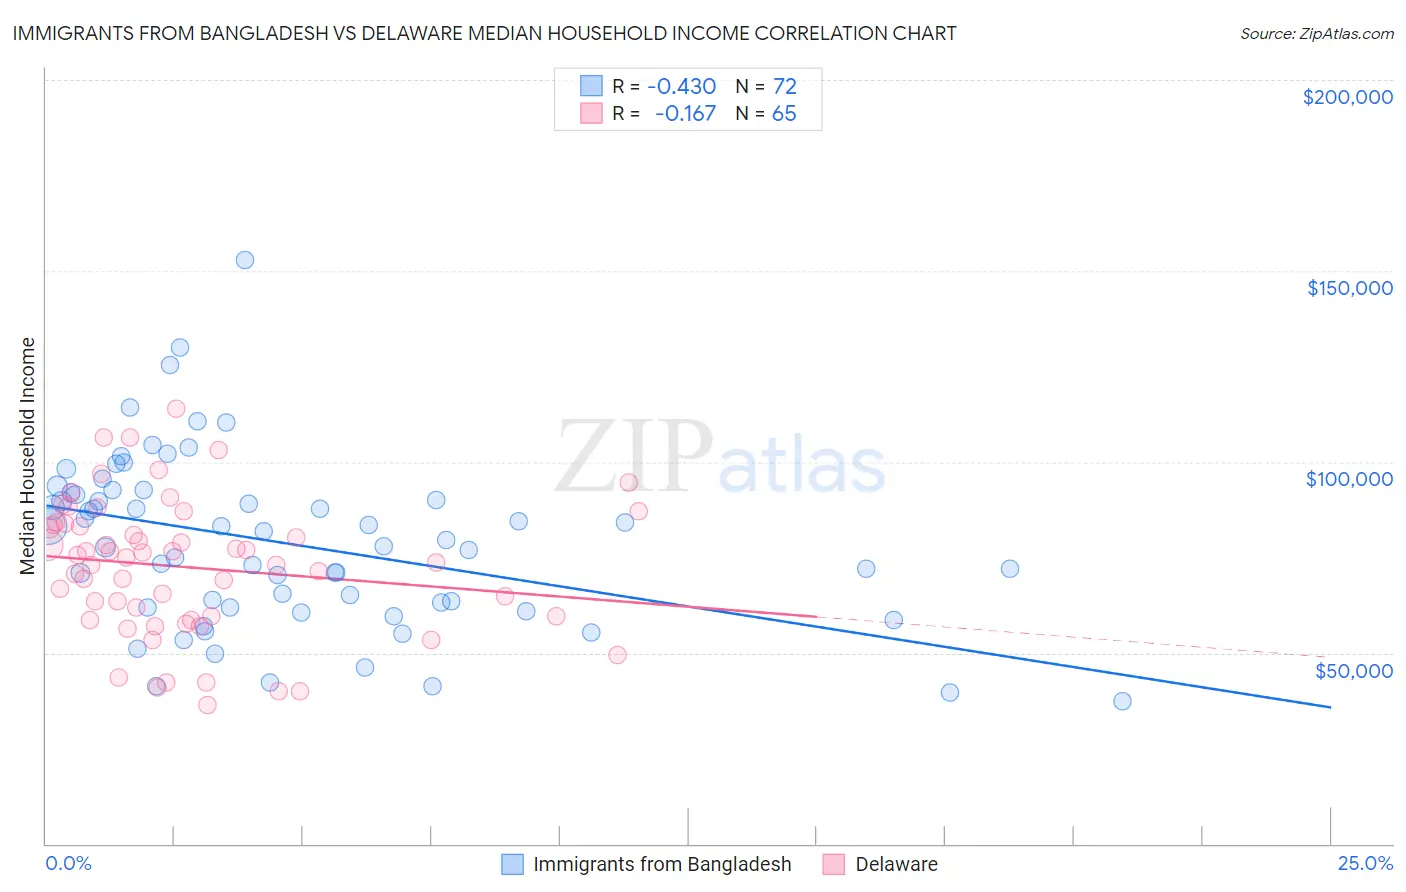
Immigrants from Bangladesh vs Delaware Median Household Income Correlation Chart
The statistical analysis conducted on geographies consisting of 203,518,199 people shows a moderate negative correlation between the proportion of Immigrants from Bangladesh and median household income in the United States with a correlation coefficient (R) of -0.430 and weighted average of $80,722. Similarly, the statistical analysis conducted on geographies consisting of 96,222,020 people shows a poor negative correlation between the proportion of Delaware and median household income in the United States with a correlation coefficient (R) of -0.167 and weighted average of $80,527, a difference of 0.24%.
Median Household Income Correlation Summary
| Measurement | Immigrants from Bangladesh | Delaware |
| Minimum | $37,309 | $36,250 |
| Maximum | $152,768 | $113,889 |
| Range | $115,459 | $77,639 |
| Mean | $78,626 | $72,395 |
| Median | $78,708 | $74,896 |
| Interquartile 25% (IQ1) | $61,856 | $59,089 |
| Interquartile 75% (IQ3) | $91,563 | $83,725 |
| Interquartile Range (IQR) | $29,707 | $24,635 |
| Standard Deviation (Sample) | $22,431 | $17,722 |
| Standard Deviation (Population) | $22,274 | $17,585 |
Demographics Similar to Immigrants from Bangladesh and Delaware by Median Household Income
In terms of median household income, the demographic groups most similar to Immigrants from Bangladesh are Guyanese ($80,734, a difference of 0.010%), Immigrants from Panama ($80,873, a difference of 0.19%), Scotch-Irish ($80,972, a difference of 0.31%), Bermudan ($80,406, a difference of 0.39%), and Trinidadian and Tobagonian ($80,402, a difference of 0.40%). Similarly, the demographic groups most similar to Delaware are Bermudan ($80,406, a difference of 0.15%), Trinidadian and Tobagonian ($80,402, a difference of 0.16%), Immigrants from Trinidad and Tobago ($80,373, a difference of 0.19%), Immigrants from the Azores ($80,357, a difference of 0.21%), and Immigrants from Ecuador ($80,341, a difference of 0.23%).
| Demographics | Rating | Rank | Median Household Income |
| Whites/Caucasians | 12.2 /100 | #218 | Poor $82,029 |
| Nigerians | 10.3 /100 | #219 | Poor $81,725 |
| Immigrants | Venezuela | 9.0 /100 | #220 | Tragic $81,506 |
| Immigrants | Ghana | 9.0 /100 | #221 | Tragic $81,489 |
| Immigrants | Nigeria | 7.7 /100 | #222 | Tragic $81,236 |
| Immigrants | El Salvador | 7.6 /100 | #223 | Tragic $81,213 |
| Malaysians | 7.0 /100 | #224 | Tragic $81,064 |
| Scotch-Irish | 6.6 /100 | #225 | Tragic $80,972 |
| Immigrants | Panama | 6.2 /100 | #226 | Tragic $80,873 |
| Guyanese | 5.7 /100 | #227 | Tragic $80,734 |
| Immigrants | Bangladesh | 5.7 /100 | #228 | Tragic $80,722 |
| Delaware | 5.0 /100 | #229 | Tragic $80,527 |
| Bermudans | 4.7 /100 | #230 | Tragic $80,406 |
| Trinidadians and Tobagonians | 4.7 /100 | #231 | Tragic $80,402 |
| Immigrants | Trinidad and Tobago | 4.6 /100 | #232 | Tragic $80,373 |
| Immigrants | Azores | 4.5 /100 | #233 | Tragic $80,357 |
| Immigrants | Ecuador | 4.5 /100 | #234 | Tragic $80,341 |
| Immigrants | Guyana | 4.5 /100 | #235 | Tragic $80,324 |
| Immigrants | Bosnia and Herzegovina | 3.4 /100 | #236 | Tragic $79,888 |
| Nicaraguans | 3.1 /100 | #237 | Tragic $79,737 |
| Barbadians | 3.0 /100 | #238 | Tragic $79,664 |