Immigrants from Bahamas vs Italian Median Male Earnings
COMPARE
Immigrants from Bahamas
Italian
Median Male Earnings
Median Male Earnings Comparison
Immigrants from Bahamas
Italians
$45,176
MEDIAN MALE EARNINGS
0.0/ 100
METRIC RATING
327th/ 347
METRIC RANK
$59,551
MEDIAN MALE EARNINGS
99.3/ 100
METRIC RATING
85th/ 347
METRIC RANK
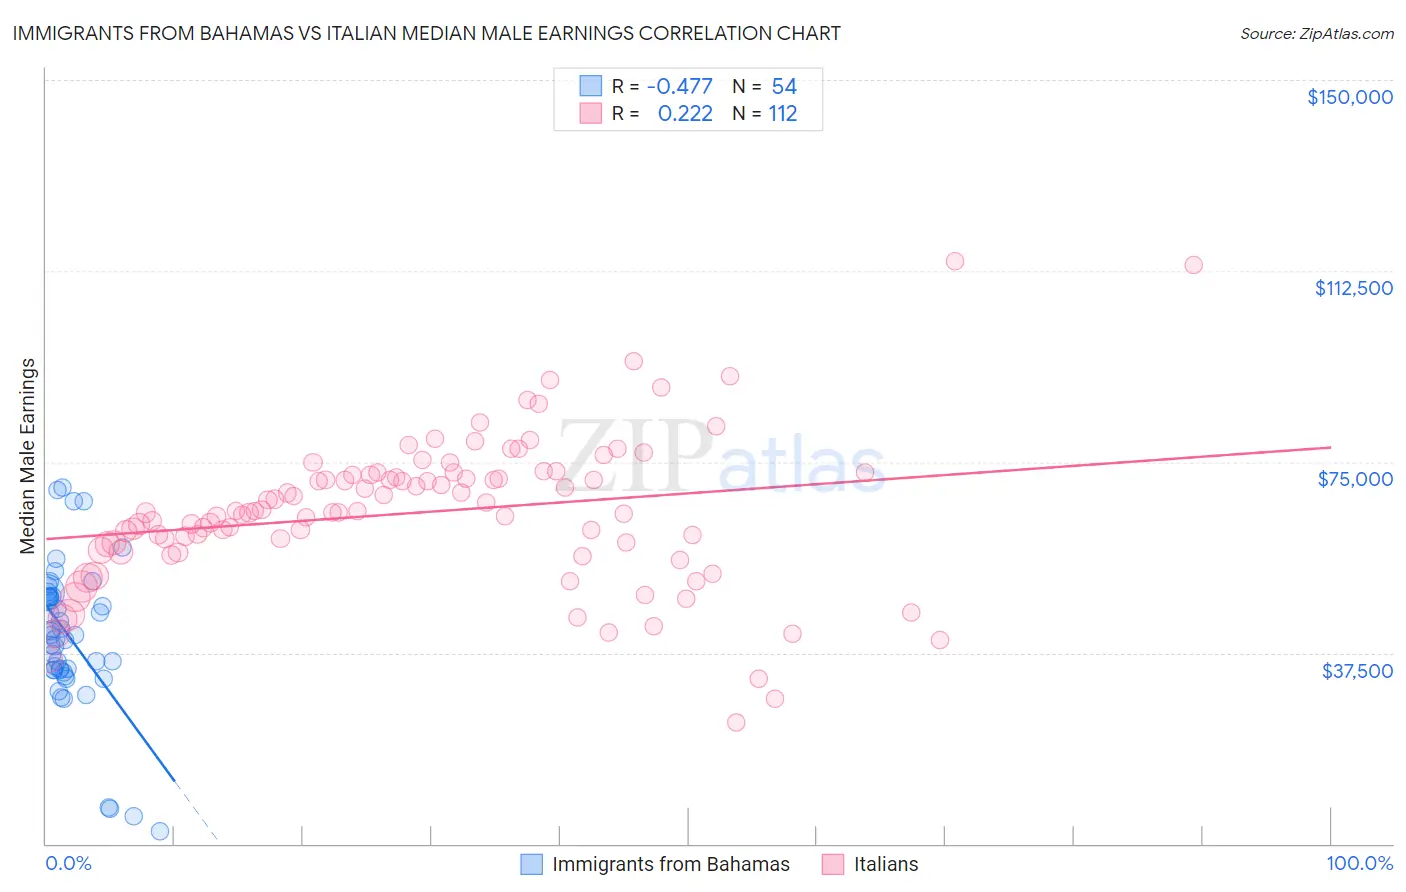
Immigrants from Bahamas vs Italian Median Male Earnings Correlation Chart
The statistical analysis conducted on geographies consisting of 104,652,587 people shows a moderate negative correlation between the proportion of Immigrants from Bahamas and median male earnings in the United States with a correlation coefficient (R) of -0.477 and weighted average of $45,176. Similarly, the statistical analysis conducted on geographies consisting of 573,649,793 people shows a weak positive correlation between the proportion of Italians and median male earnings in the United States with a correlation coefficient (R) of 0.222 and weighted average of $59,551, a difference of 31.8%.
Median Male Earnings Correlation Summary
| Measurement | Immigrants from Bahamas | Italian |
| Minimum | $2,499 | $23,704 |
| Maximum | $70,069 | $114,356 |
| Range | $67,570 | $90,652 |
| Mean | $40,703 | $65,064 |
| Median | $41,071 | $65,149 |
| Interquartile 25% (IQ1) | $34,087 | $58,270 |
| Interquartile 75% (IQ3) | $48,539 | $72,487 |
| Interquartile Range (IQR) | $14,452 | $14,217 |
| Standard Deviation (Sample) | $14,317 | $14,744 |
| Standard Deviation (Population) | $14,184 | $14,679 |
Similar Demographics by Median Male Earnings
Demographics Similar to Immigrants from Bahamas by Median Male Earnings
In terms of median male earnings, the demographic groups most similar to Immigrants from Bahamas are Kiowa ($45,094, a difference of 0.18%), Immigrants from Haiti ($45,266, a difference of 0.20%), Yakama ($45,002, a difference of 0.39%), Immigrants from Mexico ($44,960, a difference of 0.48%), and Yuman ($45,446, a difference of 0.60%).
| Demographics | Rating | Rank | Median Male Earnings |
| Immigrants | Honduras | 0.0 /100 | #320 | Tragic $45,787 |
| Fijians | 0.0 /100 | #321 | Tragic $45,607 |
| Sioux | 0.0 /100 | #322 | Tragic $45,566 |
| Immigrants | Central America | 0.0 /100 | #323 | Tragic $45,538 |
| Blacks/African Americans | 0.0 /100 | #324 | Tragic $45,523 |
| Yuman | 0.0 /100 | #325 | Tragic $45,446 |
| Immigrants | Haiti | 0.0 /100 | #326 | Tragic $45,266 |
| Immigrants | Bahamas | 0.0 /100 | #327 | Tragic $45,176 |
| Kiowa | 0.0 /100 | #328 | Tragic $45,094 |
| Yakama | 0.0 /100 | #329 | Tragic $45,002 |
| Immigrants | Mexico | 0.0 /100 | #330 | Tragic $44,960 |
| Natives/Alaskans | 0.0 /100 | #331 | Tragic $44,775 |
| Bahamians | 0.0 /100 | #332 | Tragic $44,756 |
| Immigrants | Congo | 0.0 /100 | #333 | Tragic $44,204 |
| Immigrants | Yemen | 0.0 /100 | #334 | Tragic $44,083 |
Demographics Similar to Italians by Median Male Earnings
In terms of median male earnings, the demographic groups most similar to Italians are Afghan ($59,554, a difference of 0.0%), Immigrants from England ($59,527, a difference of 0.040%), Macedonian ($59,522, a difference of 0.050%), Immigrants from Argentina ($59,491, a difference of 0.10%), and Immigrants from Moldova ($59,417, a difference of 0.23%).
| Demographics | Rating | Rank | Median Male Earnings |
| Immigrants | Egypt | 99.5 /100 | #78 | Exceptional $59,925 |
| Immigrants | Ukraine | 99.5 /100 | #79 | Exceptional $59,820 |
| Immigrants | Hungary | 99.5 /100 | #80 | Exceptional $59,806 |
| Ukrainians | 99.4 /100 | #81 | Exceptional $59,728 |
| Croatians | 99.4 /100 | #82 | Exceptional $59,715 |
| Immigrants | Italy | 99.4 /100 | #83 | Exceptional $59,691 |
| Afghans | 99.3 /100 | #84 | Exceptional $59,554 |
| Italians | 99.3 /100 | #85 | Exceptional $59,551 |
| Immigrants | England | 99.3 /100 | #86 | Exceptional $59,527 |
| Macedonians | 99.3 /100 | #87 | Exceptional $59,522 |
| Immigrants | Argentina | 99.3 /100 | #88 | Exceptional $59,491 |
| Immigrants | Moldova | 99.2 /100 | #89 | Exceptional $59,417 |
| Austrians | 99.2 /100 | #90 | Exceptional $59,359 |
| Laotians | 99.2 /100 | #91 | Exceptional $59,351 |
| Immigrants | Kazakhstan | 99.1 /100 | #92 | Exceptional $59,278 |