Immigrants from the Azores vs Tsimshian Householder Income Ages 45 - 64 years
COMPARE
Immigrants from the Azores
Tsimshian
Householder Income Ages 45 - 64 years
Householder Income Ages 45 - 64 years Comparison
Immigrants from the Azores
Tsimshian
$94,138
HOUSEHOLDER INCOME AGES 45 - 64 YEARS
4.3/ 100
METRIC RATING
226th/ 347
METRIC RANK
$96,783
HOUSEHOLDER INCOME AGES 45 - 64 YEARS
14.5/ 100
METRIC RATING
210th/ 347
METRIC RANK
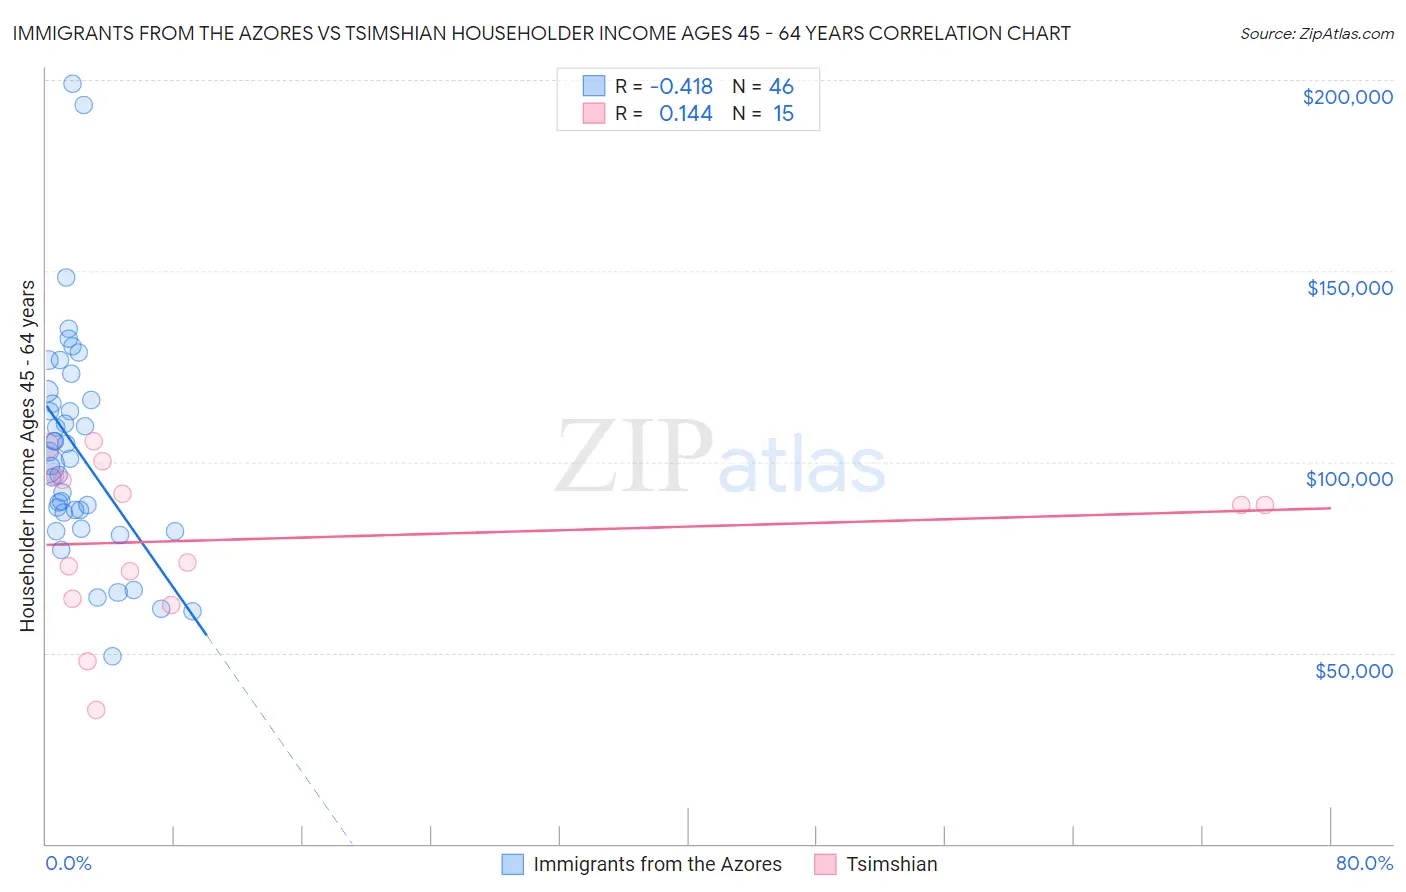
Immigrants from the Azores vs Tsimshian Householder Income Ages 45 - 64 years Correlation Chart
The statistical analysis conducted on geographies consisting of 46,245,378 people shows a moderate negative correlation between the proportion of Immigrants from the Azores and household income with householder between the ages 45 and 64 in the United States with a correlation coefficient (R) of -0.418 and weighted average of $94,138. Similarly, the statistical analysis conducted on geographies consisting of 15,616,673 people shows a poor positive correlation between the proportion of Tsimshian and household income with householder between the ages 45 and 64 in the United States with a correlation coefficient (R) of 0.144 and weighted average of $96,783, a difference of 2.8%.
Householder Income Ages 45 - 64 years Correlation Summary
| Measurement | Immigrants from the Azores | Tsimshian |
| Minimum | $49,083 | $35,000 |
| Maximum | $198,981 | $105,417 |
| Range | $149,898 | $70,417 |
| Mean | $103,017 | $79,823 |
| Median | $100,003 | $88,750 |
| Interquartile 25% (IQ1) | $86,798 | $64,063 |
| Interquartile 75% (IQ3) | $116,103 | $96,327 |
| Interquartile Range (IQR) | $29,305 | $32,264 |
| Standard Deviation (Sample) | $29,838 | $21,070 |
| Standard Deviation (Population) | $29,512 | $20,355 |
Demographics Similar to Immigrants from the Azores and Tsimshian by Householder Income Ages 45 - 64 years
In terms of householder income ages 45 - 64 years, the demographic groups most similar to Immigrants from the Azores are Bermudan ($94,197, a difference of 0.060%), Immigrants from Bosnia and Herzegovina ($94,288, a difference of 0.16%), Alaska Native ($93,991, a difference of 0.16%), Nonimmigrants ($94,448, a difference of 0.33%), and Immigrants from Panama ($93,815, a difference of 0.34%). Similarly, the demographic groups most similar to Tsimshian are Japanese ($96,834, a difference of 0.050%), Immigrants from Cambodia ($96,537, a difference of 0.26%), Scotch-Irish ($97,073, a difference of 0.30%), Venezuelan ($96,460, a difference of 0.34%), and Immigrants from Uruguay ($96,086, a difference of 0.73%).
| Demographics | Rating | Rank | Householder Income Ages 45 - 64 years |
| Scotch-Irish | 16.4 /100 | #208 | Poor $97,073 |
| Japanese | 14.8 /100 | #209 | Poor $96,834 |
| Tsimshian | 14.5 /100 | #210 | Poor $96,783 |
| Immigrants | Cambodia | 13.0 /100 | #211 | Poor $96,537 |
| Venezuelans | 12.6 /100 | #212 | Poor $96,460 |
| Immigrants | Uruguay | 10.7 /100 | #213 | Poor $96,086 |
| Panamanians | 10.6 /100 | #214 | Poor $96,066 |
| Nigerians | 8.2 /100 | #215 | Tragic $95,492 |
| Immigrants | Venezuela | 7.6 /100 | #216 | Tragic $95,342 |
| Immigrants | Ghana | 6.4 /100 | #217 | Tragic $94,982 |
| Delaware | 6.2 /100 | #218 | Tragic $94,914 |
| Immigrants | Armenia | 6.1 /100 | #219 | Tragic $94,863 |
| Salvadorans | 6.0 /100 | #220 | Tragic $94,842 |
| Immigrants | Nigeria | 5.9 /100 | #221 | Tragic $94,804 |
| Malaysians | 5.2 /100 | #222 | Tragic $94,517 |
| Immigrants | Nonimmigrants | 5.0 /100 | #223 | Tragic $94,448 |
| Immigrants | Bosnia and Herzegovina | 4.6 /100 | #224 | Tragic $94,288 |
| Bermudans | 4.4 /100 | #225 | Tragic $94,197 |
| Immigrants | Azores | 4.3 /100 | #226 | Tragic $94,138 |
| Alaska Natives | 4.0 /100 | #227 | Tragic $93,991 |
| Immigrants | Panama | 3.7 /100 | #228 | Tragic $93,815 |