Immigrants from the Azores vs Immigrants from Albania Median Male Earnings
COMPARE
Immigrants from the Azores
Immigrants from Albania
Median Male Earnings
Median Male Earnings Comparison
Immigrants from the Azores
Immigrants from Albania
$53,503
MEDIAN MALE EARNINGS
27.5/ 100
METRIC RATING
195th/ 347
METRIC RANK
$57,179
MEDIAN MALE EARNINGS
93.3/ 100
METRIC RATING
121st/ 347
METRIC RANK
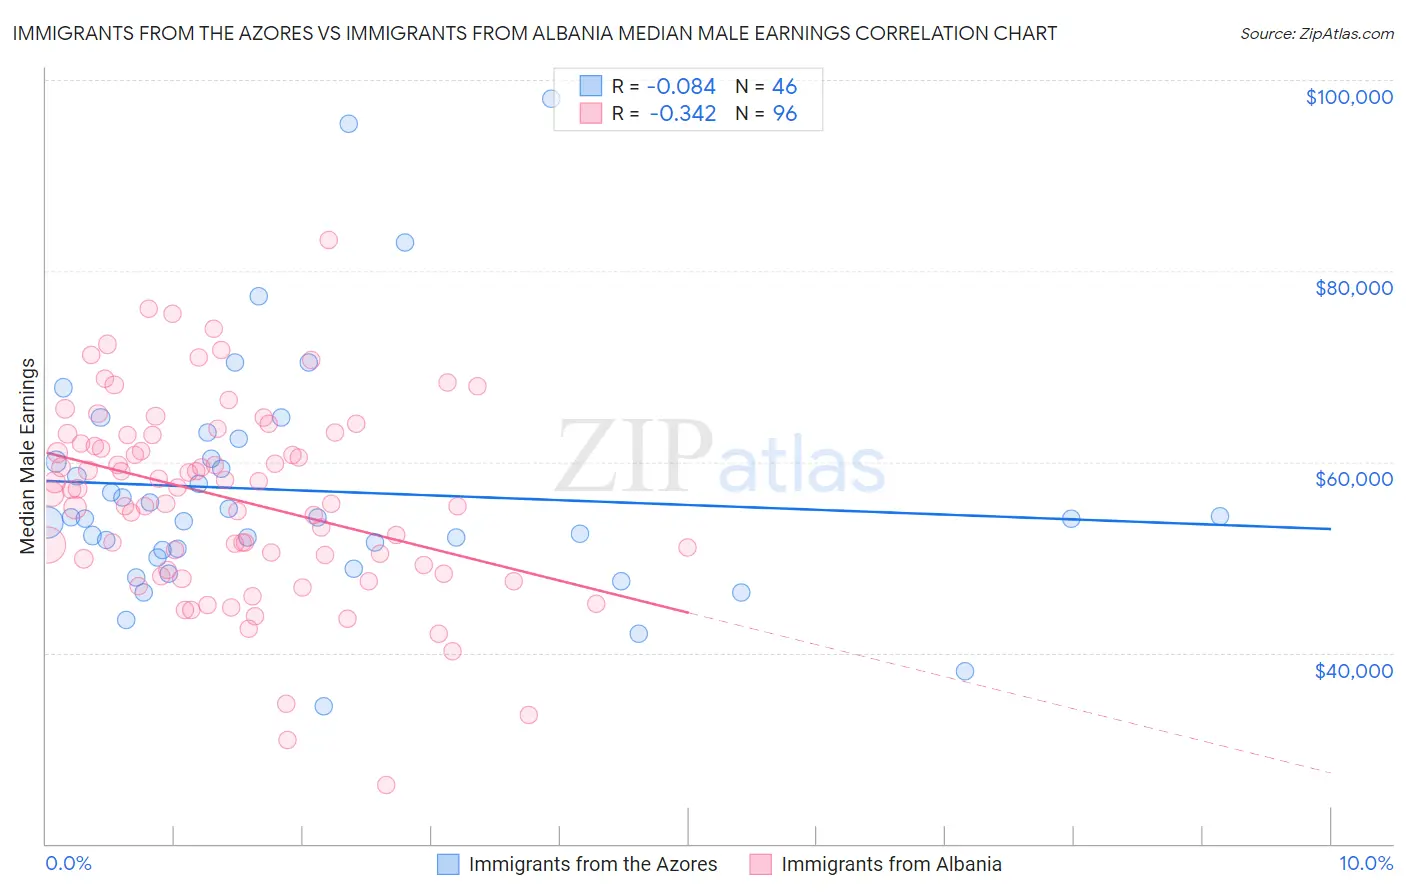
Immigrants from the Azores vs Immigrants from Albania Median Male Earnings Correlation Chart
The statistical analysis conducted on geographies consisting of 46,248,133 people shows a slight negative correlation between the proportion of Immigrants from the Azores and median male earnings in the United States with a correlation coefficient (R) of -0.084 and weighted average of $53,503. Similarly, the statistical analysis conducted on geographies consisting of 119,358,930 people shows a mild negative correlation between the proportion of Immigrants from Albania and median male earnings in the United States with a correlation coefficient (R) of -0.342 and weighted average of $57,179, a difference of 6.9%.
Median Male Earnings Correlation Summary
| Measurement | Immigrants from the Azores | Immigrants from Albania |
| Minimum | $34,438 | $26,127 |
| Maximum | $98,000 | $83,209 |
| Range | $63,562 | $57,082 |
| Mean | $56,998 | $56,160 |
| Median | $54,107 | $57,139 |
| Interquartile 25% (IQ1) | $50,771 | $49,475 |
| Interquartile 75% (IQ3) | $60,281 | $62,806 |
| Interquartile Range (IQR) | $9,510 | $13,331 |
| Standard Deviation (Sample) | $12,557 | $10,176 |
| Standard Deviation (Population) | $12,419 | $10,123 |
Similar Demographics by Median Male Earnings
Demographics Similar to Immigrants from the Azores by Median Male Earnings
In terms of median male earnings, the demographic groups most similar to Immigrants from the Azores are Immigrants from Africa ($53,457, a difference of 0.090%), Spanish ($53,576, a difference of 0.14%), Immigrants from Kenya ($53,427, a difference of 0.14%), Kenyan ($53,647, a difference of 0.27%), and Scotch-Irish ($53,658, a difference of 0.29%).
| Demographics | Rating | Rank | Median Male Earnings |
| Immigrants | Eastern Africa | 31.8 /100 | #188 | Fair $53,713 |
| Puget Sound Salish | 31.6 /100 | #189 | Fair $53,704 |
| Uruguayans | 31.1 /100 | #190 | Fair $53,680 |
| Guamanians/Chamorros | 30.7 /100 | #191 | Fair $53,661 |
| Scotch-Irish | 30.6 /100 | #192 | Fair $53,658 |
| Kenyans | 30.4 /100 | #193 | Fair $53,647 |
| Spanish | 29.0 /100 | #194 | Fair $53,576 |
| Immigrants | Azores | 27.5 /100 | #195 | Fair $53,503 |
| Immigrants | Africa | 26.6 /100 | #196 | Fair $53,457 |
| Immigrants | Kenya | 26.0 /100 | #197 | Fair $53,427 |
| Immigrants | Costa Rica | 22.6 /100 | #198 | Fair $53,237 |
| Tongans | 22.3 /100 | #199 | Fair $53,218 |
| Immigrants | Thailand | 17.5 /100 | #200 | Poor $52,908 |
| Immigrants | Bosnia and Herzegovina | 16.9 /100 | #201 | Poor $52,869 |
| Immigrants | Uruguay | 16.8 /100 | #202 | Poor $52,860 |
Demographics Similar to Immigrants from Albania by Median Male Earnings
In terms of median male earnings, the demographic groups most similar to Immigrants from Albania are Immigrants from Jordan ($57,145, a difference of 0.060%), Slovene ($57,145, a difference of 0.060%), Canadian ($57,286, a difference of 0.19%), Arab ($57,298, a difference of 0.21%), and Hungarian ($57,309, a difference of 0.23%).
| Demographics | Rating | Rank | Median Male Earnings |
| Immigrants | Kuwait | 95.3 /100 | #114 | Exceptional $57,562 |
| Swedes | 94.8 /100 | #115 | Exceptional $57,445 |
| Lebanese | 94.6 /100 | #116 | Exceptional $57,409 |
| Immigrants | Zimbabwe | 94.3 /100 | #117 | Exceptional $57,352 |
| Hungarians | 94.0 /100 | #118 | Exceptional $57,309 |
| Arabs | 94.0 /100 | #119 | Exceptional $57,298 |
| Canadians | 93.9 /100 | #120 | Exceptional $57,286 |
| Immigrants | Albania | 93.3 /100 | #121 | Exceptional $57,179 |
| Immigrants | Jordan | 93.1 /100 | #122 | Exceptional $57,145 |
| Slovenes | 93.1 /100 | #123 | Exceptional $57,145 |
| Chileans | 91.9 /100 | #124 | Exceptional $56,973 |
| Immigrants | Morocco | 91.8 /100 | #125 | Exceptional $56,958 |
| Chinese | 91.1 /100 | #126 | Exceptional $56,872 |
| Brazilians | 90.9 /100 | #127 | Exceptional $56,837 |
| Immigrants | Syria | 90.8 /100 | #128 | Exceptional $56,830 |