Immigrants from Asia vs Vietnamese Householder Income Ages 25 - 44 years

COMPARE

Immigrants from Asia
Race
Ancestry
AfghanAfricanAlaska NativeAlaskan AthabascanAlbanianAleutAlsatianAmericanApacheArabArapahoArgentineanArmenianAssyrian/Chaldean/SyriacAustralianAustrianBahamianBangladeshiBarbadianBasqueBelgianBelizeanBermudanBhutaneseBlackfeetBolivianBrazilianBritishBritish West IndianBulgarianBurmeseCajunCambodianCanadianCape VerdeanCarpatho RusynCelticCentral AmericanCentral American IndianCherokeeCheyenneChickasawChileanChineseChippewaChoctawColombianColvilleComancheCosta RicanCreeCreekCroatianCrowCubanCypriotCzechCzechoslovakianDanishDelawareDominicanDutchDutch West IndianEastern EuropeanEcuadorianEgyptianEnglishEstonianEthiopianEuropeanFijianFilipinoFinnishFrenchFrench American IndianFrench CanadianGermanGerman RussianGhanaianGreekGuamanian/ChamorroGuatemalanGuyaneseHaitianHmongHonduranHopiHoumaHungarianIcelanderIndian (Asian)IndonesianInupiatIranianIraqiIrishIroquoisIsraeliItalianJamaicanJapaneseJordanianKenyanKiowaKoreanLaotianLatvianLebaneseLiberianLithuanianLumbeeLuxembourgerMacedonianMalaysianMalteseMarshalleseMenomineeMexicanMexican American IndianMongolianMoroccanNative HawaiianNavajoNepaleseNew ZealanderNicaraguanNigerianNorthern EuropeanNorwegianOkinawanOsageOttawaPaiutePakistaniPalestinianPanamanianParaguayanPennsylvania GermanPeruvianPimaPolishPortuguesePotawatomiPuebloPuerto RicanPuget Sound SalishRomanianRussianSalvadoranSamoanScandinavianScotch-IrishScottishSeminoleSenegaleseSerbianShoshoneSierra LeoneanSiouxSlavicSlovakSloveneSomaliSouth AfricanSouth AmericanSouth American IndianSoviet UnionSpaniardSpanishSpanish AmericanSpanish American IndianSri LankanSubsaharan AfricanSudaneseSwedishSwissSyrianTaiwaneseThaiTlingit-HaidaTohono O'OdhamTonganTrinidadian and TobagonianTsimshianTurkishU.S. Virgin IslanderUgandanUkrainianUruguayanUteVenezuelanWelshWest IndianYakamaYaquiYugoslavianYumanYup'ikZimbabwean
Immigration
NonimmigrantsImmigrantsAfghanistanAfricaAlbaniaArgentinaArmeniaAsiaAustraliaAustriaBahamasBangladeshBarbadosBelarusBelgiumBelizeBoliviaBosnia and HerzegovinaBrazilBulgariaBurma/MyanmarCabo VerdeCambodiaCameroonCanadaCaribbeanCentral AmericaChileChinaColombiaCongoCosta RicaCroatiaCubaCzechoslovakiaDenmarkDominicaDominican RepublicEastern AfricaEastern AsiaEastern EuropeEcuadorEgyptEl SalvadorEnglandEritreaEthiopiaEuropeFijiFranceGermanyGhanaGreeceGrenadaGuatemalaGuyanaHaitiHondurasHong KongHungaryIndiaIndonesiaIranIraqIrelandIsraelItalyJamaicaJapanJordanKazakhstanKenyaKoreaKuwaitLaosLatin AmericaLatviaLebanonLiberiaLithuaniaMalaysiaMexicoMicronesiaMiddle AfricaMoldovaMoroccoNepalNetherlandsNicaraguaNigeriaNorth AmericaNorth MacedoniaNorthern AfricaNorthern EuropeNorwayOceaniaPakistanPanamaPeruPhilippinesPolandPortugalRomaniaRussiaSaudi ArabiaScotlandSenegalSerbiaSierra LeoneSingaporeSomaliaSouth AfricaSouth AmericaSouth Central AsiaSouth Eastern AsiaSouthern EuropeSpainSri LankaSt. Vincent and the GrenadinesSudanSwedenSwitzerlandSyriaTaiwanThailandTrinidad and TobagoTurkeyUgandaUkraineUruguayUzbekistanVenezuelaVietnamWest IndiesWestern AfricaWestern AsiaWestern EuropeYemenZaireZimbabweAzores
Vietnamese
Race
Ancestry
AfghanAfricanAlaska NativeAlaskan AthabascanAlbanianAleutAlsatianAmericanApacheArabArapahoArgentineanArmenianAssyrian/Chaldean/SyriacAustralianAustrianBahamianBangladeshiBarbadianBasqueBelgianBelizeanBermudanBhutaneseBlackfeetBolivianBrazilianBritishBritish West IndianBulgarianBurmeseCajunCambodianCanadianCape VerdeanCarpatho RusynCelticCentral AmericanCentral American IndianCherokeeCheyenneChickasawChileanChineseChippewaChoctawColombianColvilleComancheCosta RicanCreeCreekCroatianCrowCubanCypriotCzechCzechoslovakianDanishDelawareDominicanDutchDutch West IndianEastern EuropeanEcuadorianEgyptianEnglishEstonianEthiopianEuropeanFijianFilipinoFinnishFrenchFrench American IndianFrench CanadianGermanGerman RussianGhanaianGreekGuamanian/ChamorroGuatemalanGuyaneseHaitianHmongHonduranHopiHoumaHungarianIcelanderIndian (Asian)IndonesianInupiatIranianIraqiIrishIroquoisIsraeliItalianJamaicanJapaneseJordanianKenyanKiowaKoreanLaotianLatvianLebaneseLiberianLithuanianLumbeeLuxembourgerMacedonianMalaysianMalteseMarshalleseMenomineeMexicanMexican American IndianMongolianMoroccanNative HawaiianNavajoNepaleseNew ZealanderNicaraguanNigerianNorthern EuropeanNorwegianOkinawanOsageOttawaPaiutePakistaniPalestinianPanamanianParaguayanPennsylvania GermanPeruvianPimaPolishPortuguesePotawatomiPuebloPuerto RicanPuget Sound SalishRomanianRussianSalvadoranSamoanScandinavianScotch-IrishScottishSeminoleSenegaleseSerbianShoshoneSierra LeoneanSiouxSlavicSlovakSloveneSomaliSouth AfricanSouth AmericanSouth American IndianSoviet UnionSpaniardSpanishSpanish AmericanSpanish American IndianSri LankanSubsaharan AfricanSudaneseSwedishSwissSyrianTaiwaneseThaiTlingit-HaidaTohono O'OdhamTonganTrinidadian and TobagonianTsimshianTurkishU.S. Virgin IslanderUgandanUkrainianUruguayanUteVenezuelanVietnameseWelshWest IndianYakamaYaquiYugoslavianYumanYup'ikZimbabwean
Immigration
NonimmigrantsImmigrantsAfghanistanAfricaAlbaniaArgentinaArmeniaAustraliaAustriaBahamasBangladeshBarbadosBelarusBelgiumBelizeBoliviaBosnia and HerzegovinaBrazilBulgariaBurma/MyanmarCabo VerdeCambodiaCameroonCanadaCaribbeanCentral AmericaChileChinaColombiaCongoCosta RicaCroatiaCubaCzechoslovakiaDenmarkDominicaDominican RepublicEastern AfricaEastern AsiaEastern EuropeEcuadorEgyptEl SalvadorEnglandEritreaEthiopiaEuropeFijiFranceGermanyGhanaGreeceGrenadaGuatemalaGuyanaHaitiHondurasHong KongHungaryIndiaIndonesiaIranIraqIrelandIsraelItalyJamaicaJapanJordanKazakhstanKenyaKoreaKuwaitLaosLatin AmericaLatviaLebanonLiberiaLithuaniaMalaysiaMexicoMicronesiaMiddle AfricaMoldovaMoroccoNepalNetherlandsNicaraguaNigeriaNorth AmericaNorth MacedoniaNorthern AfricaNorthern EuropeNorwayOceaniaPakistanPanamaPeruPhilippinesPolandPortugalRomaniaRussiaSaudi ArabiaScotlandSenegalSerbiaSierra LeoneSingaporeSomaliaSouth AfricaSouth AmericaSouth Central AsiaSouth Eastern AsiaSouthern EuropeSpainSri LankaSt. Vincent and the GrenadinesSudanSwedenSwitzerlandSyriaTaiwanThailandTrinidad and TobagoTurkeyUgandaUkraineUruguayUzbekistanVenezuelaVietnamWest IndiesWestern AfricaWestern AsiaWestern EuropeYemenZaireZimbabweAzores
Householder Income Ages 25 - 44 years
Income
Poverty
Unemployment
Labor Participation
Family Structure
Vehicle Availability
Education Level
Disability

Householder Income Ages 25 - 44 years Comparison

Immigrants from Asia

Vietnamese

Exceptional
Fair
$110,787
HOUSEHOLDER INCOME AGES 25 - 44 YEARS
100.0/ 100
METRIC RATING
26th/ 347
METRIC RANK
$92,089
HOUSEHOLDER INCOME AGES 25 - 44 YEARS
20.2/ 100
METRIC RATING
198th/ 347
METRIC RANK

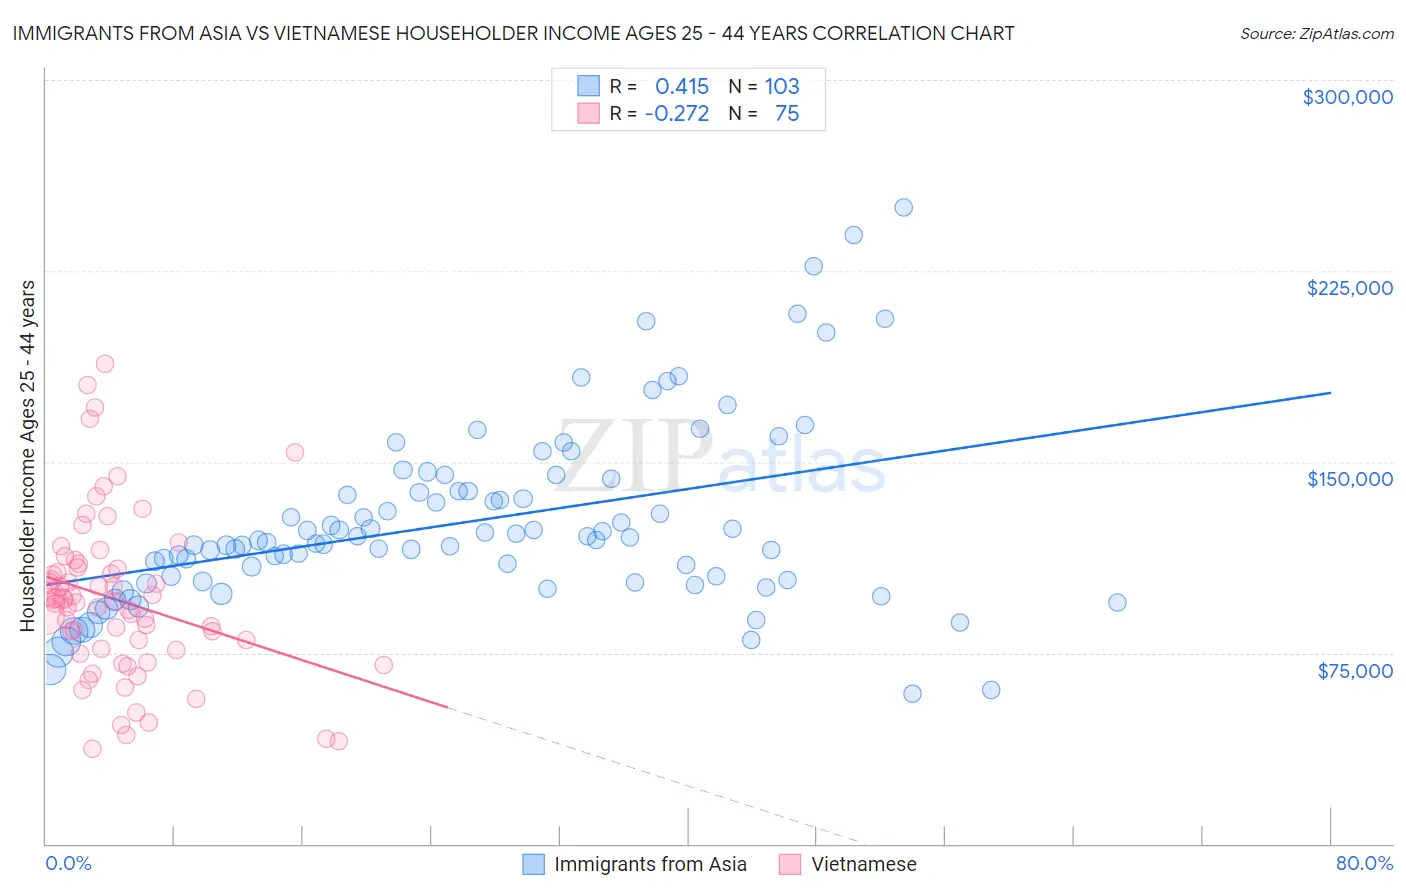
Immigrants from Asia vs Vietnamese Householder Income Ages 25 - 44 years Correlation Chart

The statistical analysis conducted on geographies consisting of 545,439,082 people shows a moderate positive correlation between the proportion of Immigrants from Asia and household income with householder between the ages 25 and 44 in the United States with a correlation coefficient (R) of 0.415 and weighted average of $110,787. Similarly, the statistical analysis conducted on geographies consisting of 170,555,303 people shows a weak negative correlation between the proportion of Vietnamese and household income with householder between the ages 25 and 44 in the United States with a correlation coefficient (R) of -0.272 and weighted average of $92,089, a difference of 20.3%.
Immigrants from Asia vs Vietnamese Householder Income Ages 25 - 44 years

Householder Income Ages 25 - 44 years Correlation Summary

MeasurementImmigrants from AsiaVietnamese
Minimum$58,833$37,508
Maximum$250,001$188,772
Range$191,168$151,264
Mean$126,497$95,810
Median$119,126$95,390
Interquartile 25% (IQ1)$102,983$76,300
Interquartile 75% (IQ3)$138,372$108,353
Interquartile Range (IQR)$35,389$32,053
Standard Deviation (Sample)$36,204$31,666
Standard Deviation (Population)$36,028$31,454

Similar Demographics by Householder Income Ages 25 - 44 years

Demographics Similar to Immigrants from Asia by Householder Income Ages 25 - 44 years

In terms of householder income ages 25 - 44 years, the demographic groups most similar to Immigrants from Asia are Russian ($110,398, a difference of 0.35%), Immigrants from Denmark ($110,363, a difference of 0.38%), Turkish ($110,318, a difference of 0.42%), Immigrants from Greece ($110,103, a difference of 0.62%), and Maltese ($110,064, a difference of 0.66%).
DemographicsRating | RankHouseholder Income Ages 25 - 44 years
Burmese
100.0
/100
|
#19
Exceptional
$113,701
Immigrants | Korea
100.0
/100
|
#20
Exceptional
$113,401
Asians
100.0
/100
|
#21
Exceptional
$112,666
Immigrants | Belgium
100.0
/100
|
#22
Exceptional
$112,575
Immigrants | Japan
100.0
/100
|
#23
Exceptional
$112,228
Immigrants | Sweden
100.0
/100
|
#24
Exceptional
$112,010
Immigrants | Northern Europe
100.0
/100
|
#25
Exceptional
$111,676
Immigrants | Asia
100.0
/100
|
#26
Exceptional
$110,787
Russians
100.0
/100
|
#27
Exceptional
$110,398
Immigrants | Denmark
100.0
/100
|
#28
Exceptional
$110,363
Turks
100.0
/100
|
#29
Exceptional
$110,318
Immigrants | Greece
100.0
/100
|
#30
Exceptional
$110,103
Maltese
100.0
/100
|
#31
Exceptional
$110,064
Immigrants | Sri Lanka
100.0
/100
|
#32
Exceptional
$109,741
Bhutanese
100.0
/100
|
#33
Exceptional
$109,520

Demographics Similar to Vietnamese by Householder Income Ages 25 - 44 years

In terms of householder income ages 25 - 44 years, the demographic groups most similar to Vietnamese are Immigrants from Colombia ($92,204, a difference of 0.12%), Spanish ($92,200, a difference of 0.12%), Celtic ($92,241, a difference of 0.16%), Immigrants from the Azores ($92,322, a difference of 0.25%), and Samoan ($92,385, a difference of 0.32%).
DemographicsRating | RankHouseholder Income Ages 25 - 44 years
Tlingit-Haida
29.4
/100
|
#191
Fair
$92,987
Immigrants | Costa Rica
28.2
/100
|
#192
Fair
$92,876
Samoans
23.0
/100
|
#193
Fair
$92,385
Immigrants | Azores
22.4
/100
|
#194
Fair
$92,322
Celtics
21.6
/100
|
#195
Fair
$92,241
Immigrants | Colombia
21.3
/100
|
#196
Fair
$92,204
Spanish
21.2
/100
|
#197
Fair
$92,200
Vietnamese
20.2
/100
|
#198
Fair
$92,089
Kenyans
16.8
/100
|
#199
Poor
$91,684
Whites/Caucasians
16.7
/100
|
#200
Poor
$91,668
Japanese
16.4
/100
|
#201
Poor
$91,624
Ecuadorians
16.0
/100
|
#202
Poor
$91,574
Immigrants | Cambodia
15.7
/100
|
#203
Poor
$91,533
Nepalese
15.4
/100
|
#204
Poor
$91,498
Immigrants | Eastern Africa
15.2
/100
|
#205
Poor
$91,458