Immigrants from Asia vs Indian (Asian) Median Earnings
COMPARE
Immigrants from Asia
Indian (Asian)
Median Earnings
Median Earnings Comparison
Immigrants from Asia
Indians (Asian)
$53,310
MEDIAN EARNINGS
100.0/ 100
METRIC RATING
32nd/ 347
METRIC RANK
$56,253
MEDIAN EARNINGS
100.0/ 100
METRIC RATING
15th/ 347
METRIC RANK
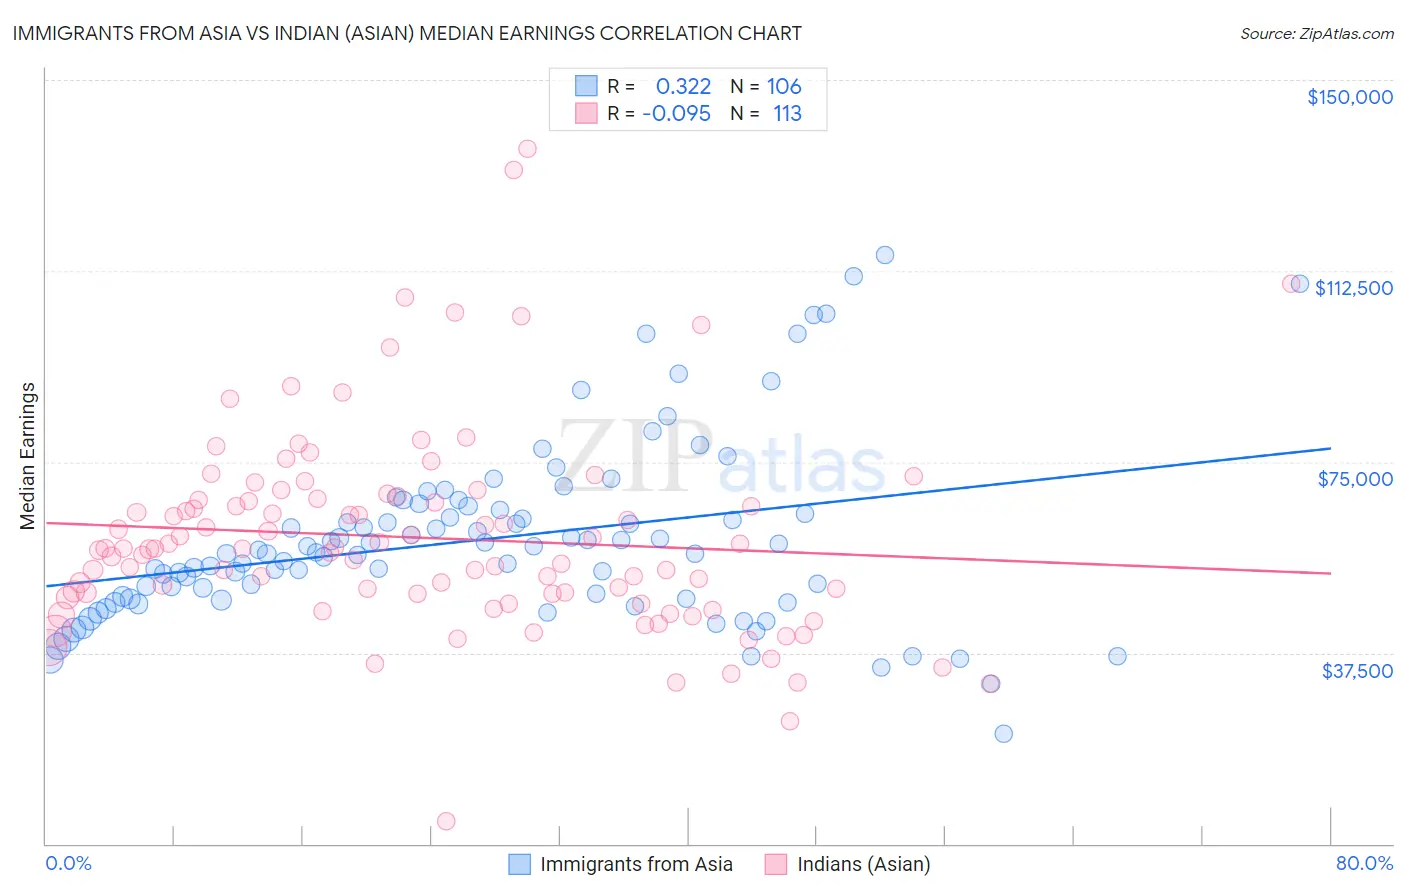
Immigrants from Asia vs Indian (Asian) Median Earnings Correlation Chart
The statistical analysis conducted on geographies consisting of 549,053,293 people shows a mild positive correlation between the proportion of Immigrants from Asia and median earnings in the United States with a correlation coefficient (R) of 0.322 and weighted average of $53,310. Similarly, the statistical analysis conducted on geographies consisting of 495,313,309 people shows a slight negative correlation between the proportion of Indians (Asian) and median earnings in the United States with a correlation coefficient (R) of -0.095 and weighted average of $56,253, a difference of 5.5%.
Median Earnings Correlation Summary
| Measurement | Immigrants from Asia | Indian (Asian) |
| Minimum | $21,667 | $4,382 |
| Maximum | $115,585 | $136,388 |
| Range | $93,918 | $132,006 |
| Mean | $59,791 | $60,085 |
| Median | $57,103 | $57,869 |
| Interquartile 25% (IQ1) | $48,160 | $48,728 |
| Interquartile 75% (IQ3) | $65,665 | $67,622 |
| Interquartile Range (IQR) | $17,505 | $18,894 |
| Standard Deviation (Sample) | $17,673 | $20,110 |
| Standard Deviation (Population) | $17,589 | $20,020 |
Demographics Similar to Immigrants from Asia and Indians (Asian) by Median Earnings
In terms of median earnings, the demographic groups most similar to Immigrants from Asia are Russian ($53,334, a difference of 0.040%), Immigrants from Greece ($53,282, a difference of 0.050%), Cambodian ($53,386, a difference of 0.14%), Immigrants from Russia ($53,457, a difference of 0.28%), and Immigrants from France ($53,490, a difference of 0.34%). Similarly, the demographic groups most similar to Indians (Asian) are Immigrants from Australia ($56,305, a difference of 0.090%), Immigrants from Eastern Asia ($56,183, a difference of 0.12%), Immigrants from China ($56,638, a difference of 0.68%), Eastern European ($55,084, a difference of 2.1%), and Immigrants from Japan ($54,938, a difference of 2.4%).
| Demographics | Rating | Rank | Median Earnings |
| Immigrants | China | 100.0 /100 | #13 | Exceptional $56,638 |
| Immigrants | Australia | 100.0 /100 | #14 | Exceptional $56,305 |
| Indians (Asian) | 100.0 /100 | #15 | Exceptional $56,253 |
| Immigrants | Eastern Asia | 100.0 /100 | #16 | Exceptional $56,183 |
| Eastern Europeans | 100.0 /100 | #17 | Exceptional $55,084 |
| Immigrants | Japan | 100.0 /100 | #18 | Exceptional $54,938 |
| Immigrants | Belgium | 100.0 /100 | #19 | Exceptional $54,679 |
| Cypriots | 100.0 /100 | #20 | Exceptional $54,589 |
| Burmese | 100.0 /100 | #21 | Exceptional $54,559 |
| Immigrants | Korea | 100.0 /100 | #22 | Exceptional $54,530 |
| Immigrants | Sweden | 100.0 /100 | #23 | Exceptional $54,478 |
| Soviet Union | 100.0 /100 | #24 | Exceptional $54,290 |
| Turks | 100.0 /100 | #25 | Exceptional $53,919 |
| Immigrants | Northern Europe | 100.0 /100 | #26 | Exceptional $53,872 |
| Asians | 100.0 /100 | #27 | Exceptional $53,690 |
| Immigrants | France | 100.0 /100 | #28 | Exceptional $53,490 |
| Immigrants | Russia | 100.0 /100 | #29 | Exceptional $53,457 |
| Cambodians | 100.0 /100 | #30 | Exceptional $53,386 |
| Russians | 100.0 /100 | #31 | Exceptional $53,334 |
| Immigrants | Asia | 100.0 /100 | #32 | Exceptional $53,310 |
| Immigrants | Greece | 100.0 /100 | #33 | Exceptional $53,282 |