Immigrants from Armenia vs Ecuadorian Median Family Income
COMPARE
Immigrants from Armenia
Ecuadorian
Median Family Income
Median Family Income Comparison
Immigrants from Armenia
Ecuadorians
$97,605
MEDIAN FAMILY INCOME
7.0/ 100
METRIC RATING
213th/ 347
METRIC RANK
$95,114
MEDIAN FAMILY INCOME
2.1/ 100
METRIC RATING
231st/ 347
METRIC RANK
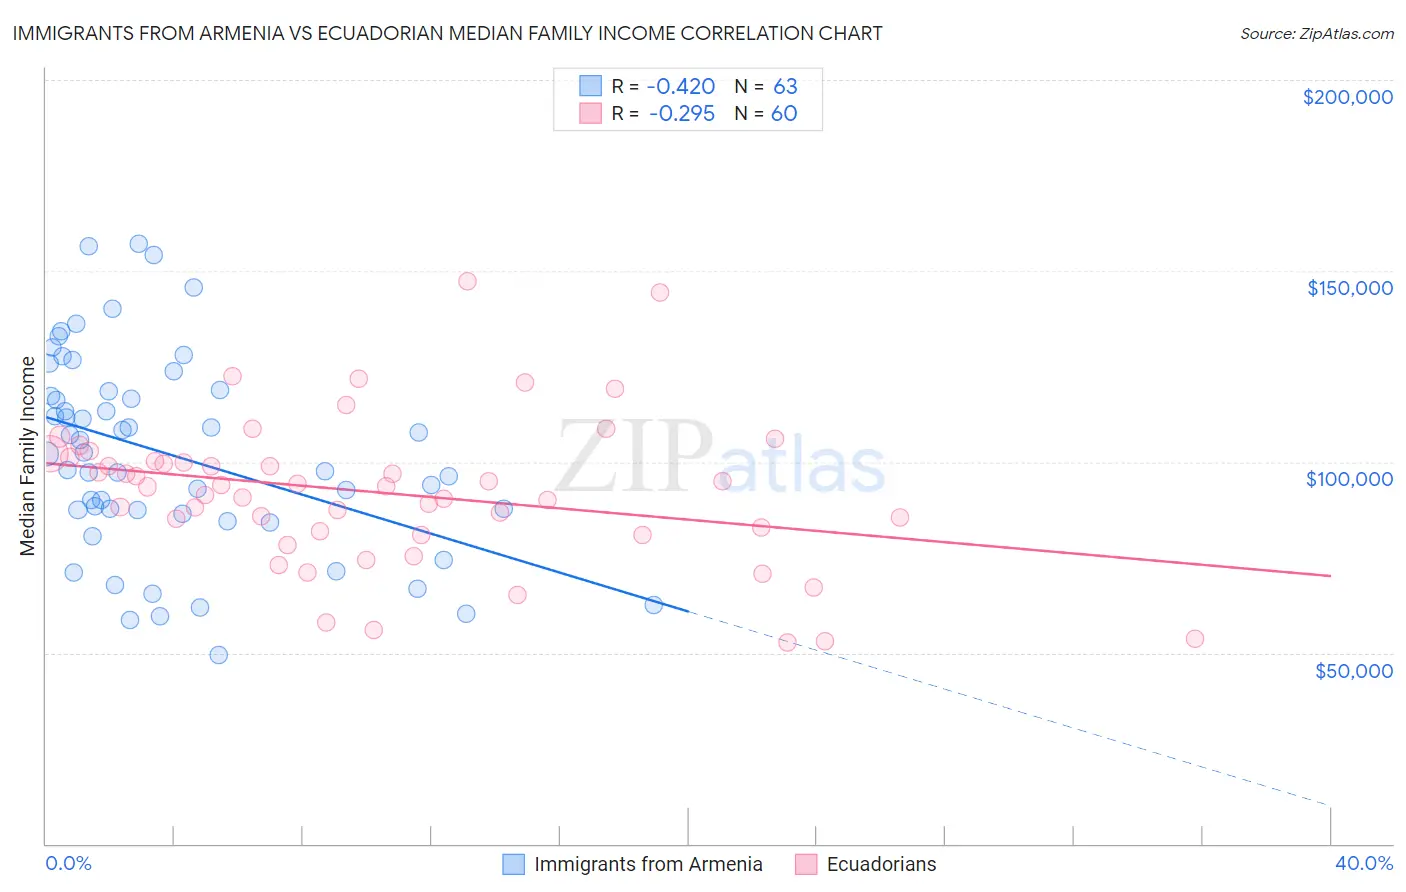
Immigrants from Armenia vs Ecuadorian Median Family Income Correlation Chart
The statistical analysis conducted on geographies consisting of 97,713,870 people shows a moderate negative correlation between the proportion of Immigrants from Armenia and median family income in the United States with a correlation coefficient (R) of -0.420 and weighted average of $97,605. Similarly, the statistical analysis conducted on geographies consisting of 317,539,775 people shows a weak negative correlation between the proportion of Ecuadorians and median family income in the United States with a correlation coefficient (R) of -0.295 and weighted average of $95,114, a difference of 2.6%.
Median Family Income Correlation Summary
| Measurement | Immigrants from Armenia | Ecuadorian |
| Minimum | $49,583 | $52,846 |
| Maximum | $157,199 | $147,371 |
| Range | $107,616 | $94,525 |
| Mean | $101,713 | $91,870 |
| Median | $102,061 | $93,530 |
| Interquartile 25% (IQ1) | $86,292 | $81,441 |
| Interquartile 75% (IQ3) | $118,550 | $100,588 |
| Interquartile Range (IQR) | $32,258 | $19,147 |
| Standard Deviation (Sample) | $25,932 | $19,583 |
| Standard Deviation (Population) | $25,725 | $19,420 |
Demographics Similar to Immigrants from Armenia and Ecuadorians by Median Family Income
In terms of median family income, the demographic groups most similar to Immigrants from Armenia are Bermudan ($97,577, a difference of 0.030%), Panamanian ($97,683, a difference of 0.080%), Nigerian ($97,522, a difference of 0.090%), Immigrants from Bosnia and Herzegovina ($97,432, a difference of 0.18%), and Japanese ($97,288, a difference of 0.33%). Similarly, the demographic groups most similar to Ecuadorians are Malaysian ($95,230, a difference of 0.12%), Marshallese ($95,293, a difference of 0.19%), Immigrants from Venezuela ($94,904, a difference of 0.22%), Immigrants from the Azores ($95,402, a difference of 0.30%), and Alaska Native ($95,573, a difference of 0.48%).
| Demographics | Rating | Rank | Median Family Income |
| Panamanians | 7.2 /100 | #212 | Tragic $97,683 |
| Immigrants | Armenia | 7.0 /100 | #213 | Tragic $97,605 |
| Bermudans | 6.9 /100 | #214 | Tragic $97,577 |
| Nigerians | 6.7 /100 | #215 | Tragic $97,522 |
| Immigrants | Bosnia and Herzegovina | 6.4 /100 | #216 | Tragic $97,432 |
| Japanese | 6.0 /100 | #217 | Tragic $97,288 |
| Immigrants | Cambodia | 5.8 /100 | #218 | Tragic $97,222 |
| Delaware | 5.1 /100 | #219 | Tragic $96,958 |
| Sudanese | 4.7 /100 | #220 | Tragic $96,783 |
| Immigrants | Ghana | 4.2 /100 | #221 | Tragic $96,544 |
| Immigrants | Nigeria | 4.0 /100 | #222 | Tragic $96,439 |
| Venezuelans | 3.7 /100 | #223 | Tragic $96,281 |
| Immigrants | Nonimmigrants | 3.6 /100 | #224 | Tragic $96,231 |
| Vietnamese | 3.4 /100 | #225 | Tragic $96,123 |
| Immigrants | Panama | 2.7 /100 | #226 | Tragic $95,647 |
| Alaska Natives | 2.6 /100 | #227 | Tragic $95,573 |
| Immigrants | Azores | 2.4 /100 | #228 | Tragic $95,402 |
| Marshallese | 2.2 /100 | #229 | Tragic $95,293 |
| Malaysians | 2.2 /100 | #230 | Tragic $95,230 |
| Ecuadorians | 2.1 /100 | #231 | Tragic $95,114 |
| Immigrants | Venezuela | 1.9 /100 | #232 | Tragic $94,904 |