Immigrants from Argentina vs Armenian Median Male Earnings
COMPARE
Immigrants from Argentina
Armenian
Median Male Earnings
Median Male Earnings Comparison
Immigrants from Argentina
Armenians
$59,491
MEDIAN MALE EARNINGS
99.3/ 100
METRIC RATING
88th/ 347
METRIC RANK
$58,134
MEDIAN MALE EARNINGS
97.3/ 100
METRIC RATING
104th/ 347
METRIC RANK
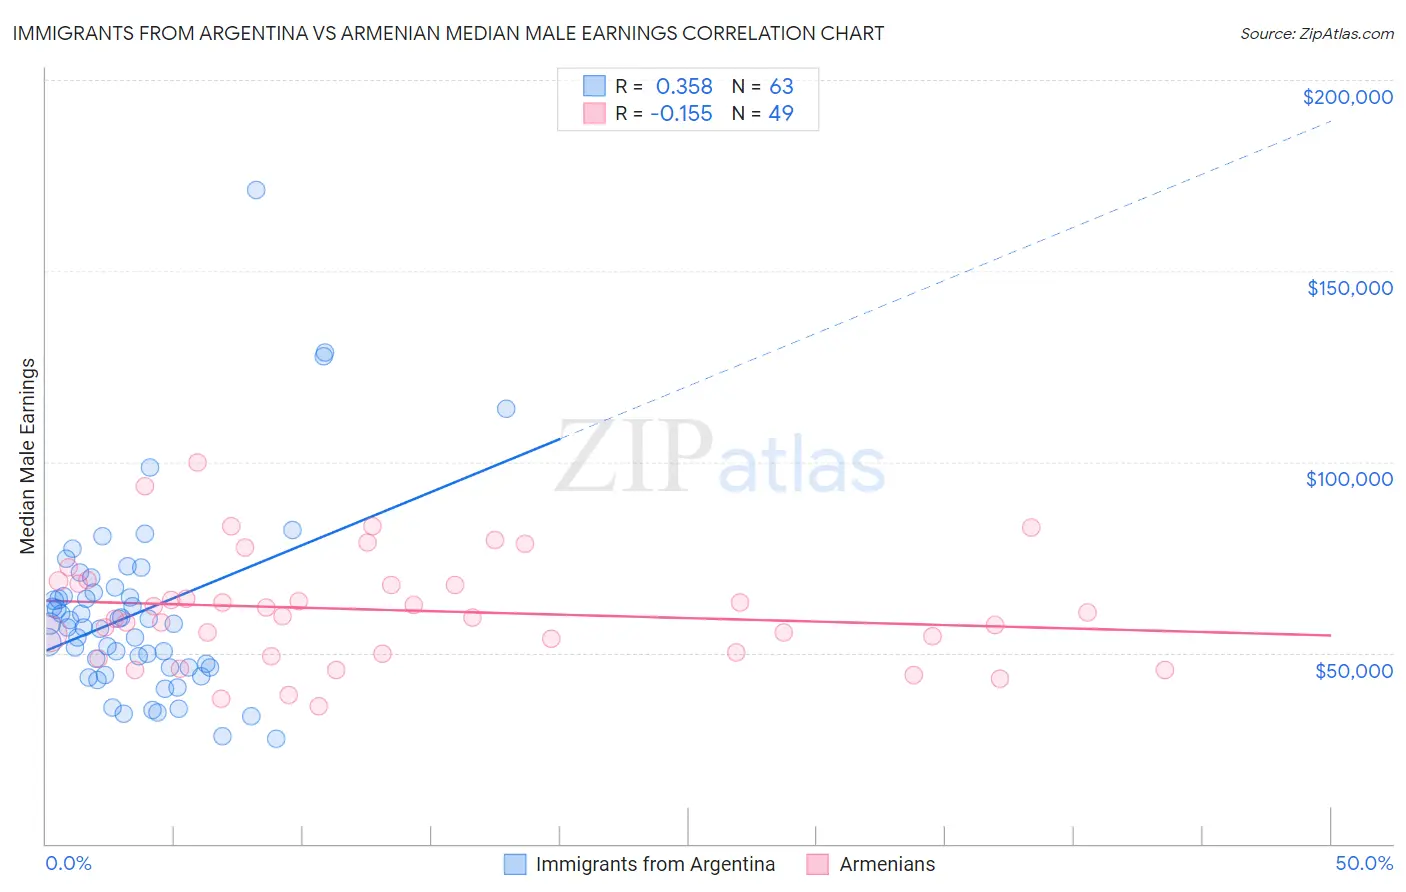
Immigrants from Argentina vs Armenian Median Male Earnings Correlation Chart
The statistical analysis conducted on geographies consisting of 264,393,462 people shows a mild positive correlation between the proportion of Immigrants from Argentina and median male earnings in the United States with a correlation coefficient (R) of 0.358 and weighted average of $59,491. Similarly, the statistical analysis conducted on geographies consisting of 310,896,747 people shows a poor negative correlation between the proportion of Armenians and median male earnings in the United States with a correlation coefficient (R) of -0.155 and weighted average of $58,134, a difference of 2.3%.
Median Male Earnings Correlation Summary
| Measurement | Immigrants from Argentina | Armenian |
| Minimum | $27,639 | $36,151 |
| Maximum | $171,304 | $99,997 |
| Range | $143,665 | $63,846 |
| Mean | $60,629 | $61,183 |
| Median | $57,556 | $59,670 |
| Interquartile 25% (IQ1) | $46,111 | $49,867 |
| Interquartile 75% (IQ3) | $65,873 | $68,550 |
| Interquartile Range (IQR) | $19,762 | $18,683 |
| Standard Deviation (Sample) | $24,754 | $14,235 |
| Standard Deviation (Population) | $24,557 | $14,089 |
Demographics Similar to Immigrants from Argentina and Armenians by Median Male Earnings
In terms of median male earnings, the demographic groups most similar to Immigrants from Argentina are Macedonian ($59,522, a difference of 0.050%), Immigrants from England ($59,527, a difference of 0.060%), Immigrants from Moldova ($59,417, a difference of 0.12%), Austrian ($59,359, a difference of 0.22%), and Laotian ($59,351, a difference of 0.24%). Similarly, the demographic groups most similar to Armenians are Polish ($58,139, a difference of 0.010%), Immigrants from Western Asia ($58,131, a difference of 0.010%), Syrian ($58,187, a difference of 0.090%), Immigrants from Northern Africa ($58,008, a difference of 0.22%), and Immigrants from Brazil ($58,324, a difference of 0.33%).
| Demographics | Rating | Rank | Median Male Earnings |
| Immigrants | England | 99.3 /100 | #86 | Exceptional $59,527 |
| Macedonians | 99.3 /100 | #87 | Exceptional $59,522 |
| Immigrants | Argentina | 99.3 /100 | #88 | Exceptional $59,491 |
| Immigrants | Moldova | 99.2 /100 | #89 | Exceptional $59,417 |
| Austrians | 99.2 /100 | #90 | Exceptional $59,359 |
| Laotians | 99.2 /100 | #91 | Exceptional $59,351 |
| Immigrants | Kazakhstan | 99.1 /100 | #92 | Exceptional $59,278 |
| Immigrants | Southern Europe | 99.0 /100 | #93 | Exceptional $59,217 |
| Immigrants | North Macedonia | 99.0 /100 | #94 | Exceptional $59,189 |
| Immigrants | Lebanon | 98.6 /100 | #95 | Exceptional $58,835 |
| Albanians | 98.4 /100 | #96 | Exceptional $58,680 |
| Northern Europeans | 98.2 /100 | #97 | Exceptional $58,588 |
| Jordanians | 98.1 /100 | #98 | Exceptional $58,500 |
| Immigrants | Poland | 98.0 /100 | #99 | Exceptional $58,452 |
| Assyrians/Chaldeans/Syriacs | 97.9 /100 | #100 | Exceptional $58,437 |
| Immigrants | Brazil | 97.7 /100 | #101 | Exceptional $58,324 |
| Syrians | 97.4 /100 | #102 | Exceptional $58,187 |
| Poles | 97.3 /100 | #103 | Exceptional $58,139 |
| Armenians | 97.3 /100 | #104 | Exceptional $58,134 |
| Immigrants | Western Asia | 97.3 /100 | #105 | Exceptional $58,131 |
| Immigrants | Northern Africa | 96.9 /100 | #106 | Exceptional $58,008 |