Immigrants from Albania vs Marshallese Per Capita Income
COMPARE
Immigrants from Albania
Marshallese
Per Capita Income
Per Capita Income Comparison
Immigrants from Albania
Marshallese
$46,387
PER CAPITA INCOME
95.5/ 100
METRIC RATING
113th/ 347
METRIC RANK
$39,108
PER CAPITA INCOME
0.6/ 100
METRIC RATING
261st/ 347
METRIC RANK
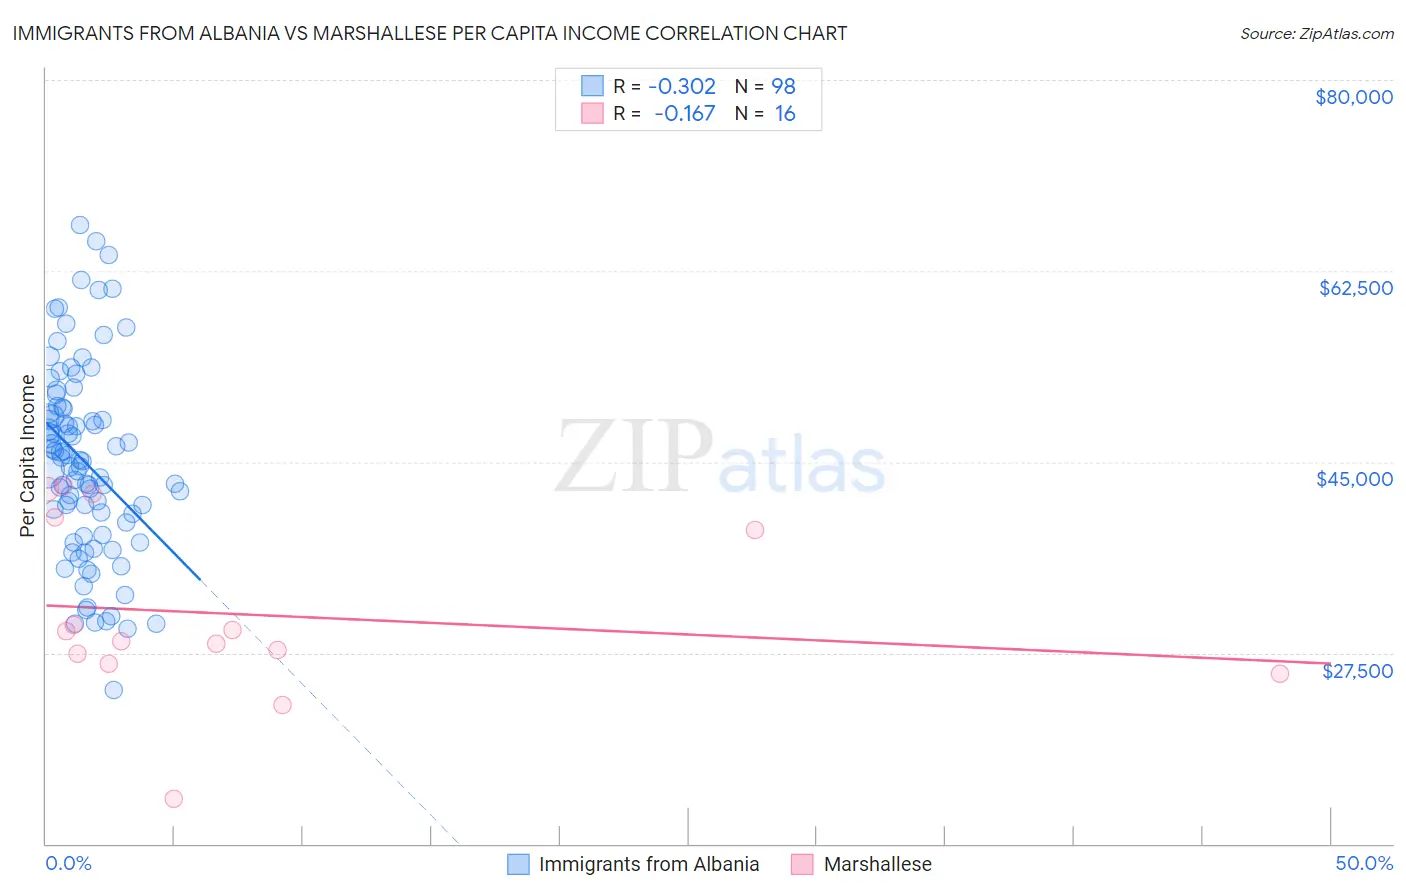
Immigrants from Albania vs Marshallese Per Capita Income Correlation Chart
The statistical analysis conducted on geographies consisting of 119,376,608 people shows a mild negative correlation between the proportion of Immigrants from Albania and per capita income in the United States with a correlation coefficient (R) of -0.302 and weighted average of $46,387. Similarly, the statistical analysis conducted on geographies consisting of 14,761,315 people shows a poor negative correlation between the proportion of Marshallese and per capita income in the United States with a correlation coefficient (R) of -0.167 and weighted average of $39,108, a difference of 18.6%.
Per Capita Income Correlation Summary
| Measurement | Immigrants from Albania | Marshallese |
| Minimum | $24,123 | $14,082 |
| Maximum | $66,738 | $42,763 |
| Range | $42,615 | $28,681 |
| Mean | $45,029 | $31,016 |
| Median | $45,153 | $29,047 |
| Interquartile 25% (IQ1) | $39,496 | $26,970 |
| Interquartile 75% (IQ3) | $49,916 | $39,382 |
| Interquartile Range (IQR) | $10,420 | $12,413 |
| Standard Deviation (Sample) | $8,753 | $8,089 |
| Standard Deviation (Population) | $8,708 | $7,833 |
Similar Demographics by Per Capita Income
Demographics Similar to Immigrants from Albania by Per Capita Income
In terms of per capita income, the demographic groups most similar to Immigrants from Albania are Immigrants from Morocco ($46,430, a difference of 0.090%), Taiwanese ($46,455, a difference of 0.14%), Chilean ($46,459, a difference of 0.15%), Afghan ($46,268, a difference of 0.26%), and Immigrants from Northern Africa ($46,531, a difference of 0.31%).
| Demographics | Rating | Rank | Per Capita Income |
| Ethiopians | 96.3 /100 | #106 | Exceptional $46,569 |
| Serbians | 96.2 /100 | #107 | Exceptional $46,551 |
| Immigrants | Kuwait | 96.2 /100 | #108 | Exceptional $46,543 |
| Immigrants | Northern Africa | 96.2 /100 | #109 | Exceptional $46,531 |
| Chileans | 95.9 /100 | #110 | Exceptional $46,459 |
| Taiwanese | 95.8 /100 | #111 | Exceptional $46,455 |
| Immigrants | Morocco | 95.7 /100 | #112 | Exceptional $46,430 |
| Immigrants | Albania | 95.5 /100 | #113 | Exceptional $46,387 |
| Afghans | 94.9 /100 | #114 | Exceptional $46,268 |
| Immigrants | Chile | 94.6 /100 | #115 | Exceptional $46,213 |
| Poles | 94.1 /100 | #116 | Exceptional $46,123 |
| Chinese | 93.9 /100 | #117 | Exceptional $46,098 |
| Immigrants | Saudi Arabia | 93.3 /100 | #118 | Exceptional $46,008 |
| Immigrants | Poland | 93.1 /100 | #119 | Exceptional $45,979 |
| Immigrants | Ethiopia | 92.7 /100 | #120 | Exceptional $45,923 |
Demographics Similar to Marshallese by Per Capita Income
In terms of per capita income, the demographic groups most similar to Marshallese are Iroquois ($39,104, a difference of 0.010%), Belizean ($39,097, a difference of 0.030%), Alaskan Athabascan ($39,163, a difference of 0.14%), American ($39,039, a difference of 0.17%), and Malaysian ($39,194, a difference of 0.22%).
| Demographics | Rating | Rank | Per Capita Income |
| Alaska Natives | 1.0 /100 | #254 | Tragic $39,558 |
| Immigrants | Middle Africa | 1.0 /100 | #255 | Tragic $39,529 |
| Hawaiians | 0.8 /100 | #256 | Tragic $39,403 |
| Nicaraguans | 0.8 /100 | #257 | Tragic $39,372 |
| Jamaicans | 0.7 /100 | #258 | Tragic $39,231 |
| Malaysians | 0.7 /100 | #259 | Tragic $39,194 |
| Alaskan Athabascans | 0.6 /100 | #260 | Tragic $39,163 |
| Marshallese | 0.6 /100 | #261 | Tragic $39,108 |
| Iroquois | 0.6 /100 | #262 | Tragic $39,104 |
| Belizeans | 0.6 /100 | #263 | Tragic $39,097 |
| Americans | 0.6 /100 | #264 | Tragic $39,039 |
| Spanish Americans | 0.5 /100 | #265 | Tragic $39,012 |
| Salvadorans | 0.5 /100 | #266 | Tragic $38,858 |
| Immigrants | Zaire | 0.4 /100 | #267 | Tragic $38,848 |
| Liberians | 0.4 /100 | #268 | Tragic $38,780 |