Immigrants from Albania vs Immigrants from Northern Africa Householder Income Under 25 years
COMPARE
Immigrants from Albania
Immigrants from Northern Africa
Householder Income Under 25 years
Householder Income Under 25 years Comparison
Immigrants from Albania
Immigrants from Northern Africa
$53,597
HOUSEHOLDER INCOME UNDER 25 YEARS
96.9/ 100
METRIC RATING
115th/ 347
METRIC RANK
$53,185
HOUSEHOLDER INCOME UNDER 25 YEARS
91.9/ 100
METRIC RATING
134th/ 347
METRIC RANK
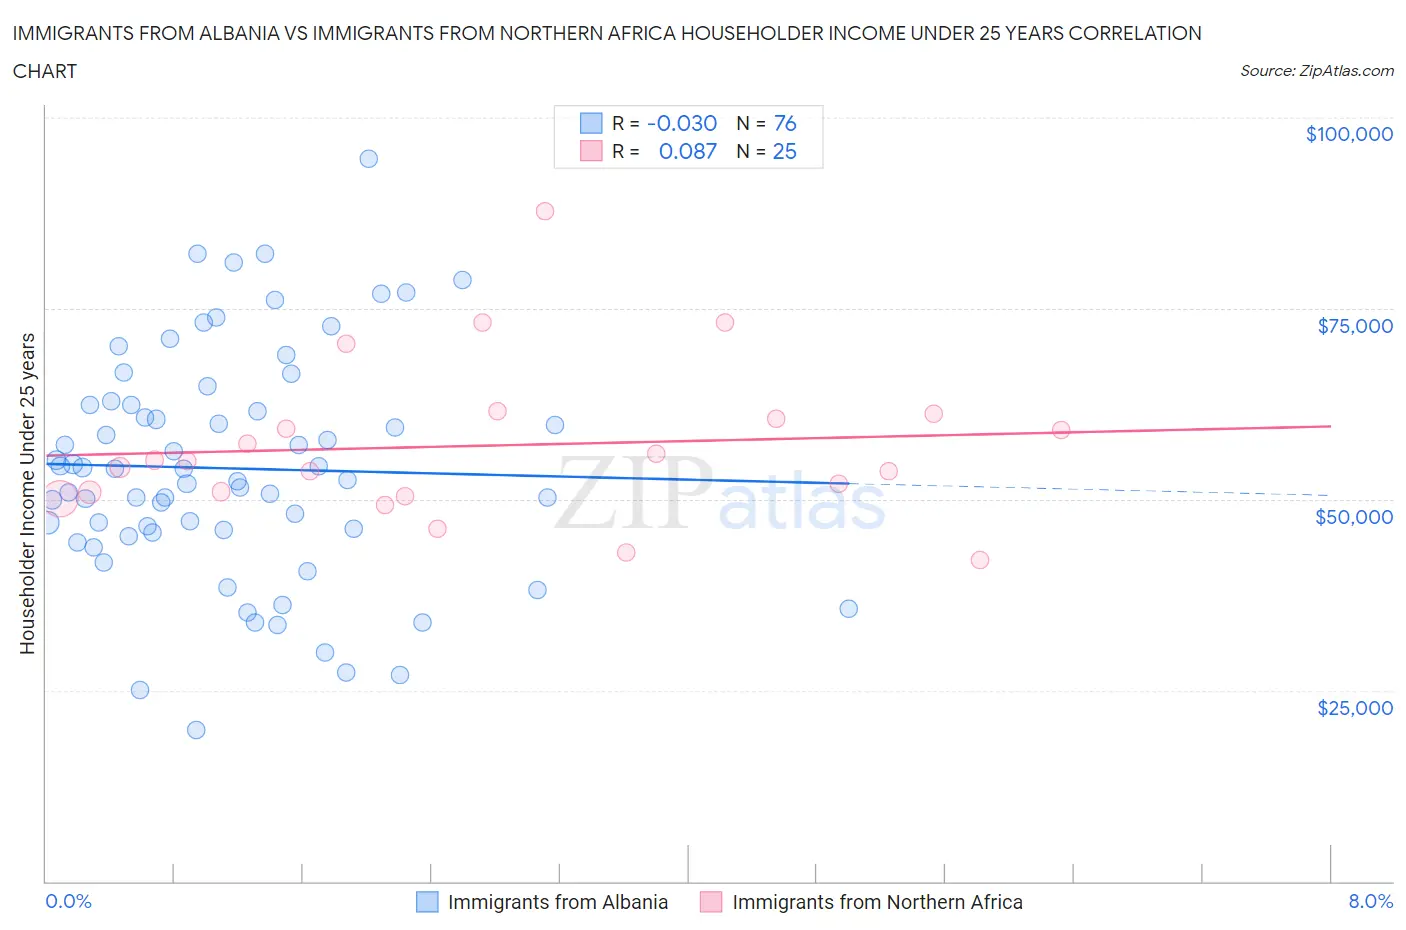
Immigrants from Albania vs Immigrants from Northern Africa Householder Income Under 25 years Correlation Chart
The statistical analysis conducted on geographies consisting of 107,044,611 people shows no correlation between the proportion of Immigrants from Albania and household income with householder under the age of 25 in the United States with a correlation coefficient (R) of -0.030 and weighted average of $53,597. Similarly, the statistical analysis conducted on geographies consisting of 276,331,294 people shows a slight positive correlation between the proportion of Immigrants from Northern Africa and household income with householder under the age of 25 in the United States with a correlation coefficient (R) of 0.087 and weighted average of $53,185, a difference of 0.77%.
Householder Income Under 25 years Correlation Summary
| Measurement | Immigrants from Albania | Immigrants from Northern Africa |
| Minimum | $19,811 | $42,109 |
| Maximum | $94,545 | $87,806 |
| Range | $74,734 | $45,697 |
| Mean | $54,041 | $57,056 |
| Median | $53,274 | $55,032 |
| Interquartile 25% (IQ1) | $45,869 | $50,695 |
| Interquartile 75% (IQ3) | $62,406 | $60,900 |
| Interquartile Range (IQR) | $16,537 | $10,206 |
| Standard Deviation (Sample) | $14,993 | $10,275 |
| Standard Deviation (Population) | $14,894 | $10,068 |
Demographics Similar to Immigrants from Albania and Immigrants from Northern Africa by Householder Income Under 25 years
In terms of householder income under 25 years, the demographic groups most similar to Immigrants from Albania are Immigrants from Sweden ($53,621, a difference of 0.040%), Immigrants from Spain ($53,560, a difference of 0.070%), Lithuanian ($53,552, a difference of 0.080%), Immigrants from Switzerland ($53,528, a difference of 0.13%), and Italian ($53,426, a difference of 0.32%). Similarly, the demographic groups most similar to Immigrants from Northern Africa are Immigrants ($53,201, a difference of 0.030%), Moroccan ($53,256, a difference of 0.13%), Immigrants from Nicaragua ($53,266, a difference of 0.15%), Nicaraguan ($53,275, a difference of 0.17%), and New Zealander ($53,294, a difference of 0.20%).
| Demographics | Rating | Rank | Householder Income Under 25 years |
| Immigrants | Sweden | 97.1 /100 | #114 | Exceptional $53,621 |
| Immigrants | Albania | 96.9 /100 | #115 | Exceptional $53,597 |
| Immigrants | Spain | 96.6 /100 | #116 | Exceptional $53,560 |
| Lithuanians | 96.6 /100 | #117 | Exceptional $53,552 |
| Immigrants | Switzerland | 96.3 /100 | #118 | Exceptional $53,528 |
| Italians | 95.4 /100 | #119 | Exceptional $53,426 |
| Guamanians/Chamorros | 95.3 /100 | #120 | Exceptional $53,423 |
| Immigrants | Canada | 95.2 /100 | #121 | Exceptional $53,411 |
| Immigrants | Ethiopia | 95.2 /100 | #122 | Exceptional $53,408 |
| Immigrants | Iraq | 94.9 /100 | #123 | Exceptional $53,384 |
| Colombians | 94.6 /100 | #124 | Exceptional $53,357 |
| Pakistanis | 94.1 /100 | #125 | Exceptional $53,325 |
| Immigrants | Serbia | 94.1 /100 | #126 | Exceptional $53,321 |
| Immigrants | North America | 93.9 /100 | #127 | Exceptional $53,307 |
| Immigrants | Bulgaria | 93.9 /100 | #128 | Exceptional $53,305 |
| New Zealanders | 93.7 /100 | #129 | Exceptional $53,294 |
| Nicaraguans | 93.4 /100 | #130 | Exceptional $53,275 |
| Immigrants | Nicaragua | 93.3 /100 | #131 | Exceptional $53,266 |
| Moroccans | 93.1 /100 | #132 | Exceptional $53,256 |
| Immigrants | Immigrants | 92.2 /100 | #133 | Exceptional $53,201 |
| Immigrants | Northern Africa | 91.9 /100 | #134 | Exceptional $53,185 |