Immigrants from Afghanistan vs Immigrants from Romania Householder Income Ages 25 - 44 years

COMPARE

Immigrants from Afghanistan
Race
Ancestry
AfghanAfricanAlaska NativeAlaskan AthabascanAlbanianAleutAlsatianAmericanApacheArabArapahoArgentineanArmenianAssyrian/Chaldean/SyriacAustralianAustrianBahamianBangladeshiBarbadianBasqueBelgianBelizeanBermudanBhutaneseBlackfeetBolivianBrazilianBritishBritish West IndianBulgarianBurmeseCajunCambodianCanadianCape VerdeanCarpatho RusynCelticCentral AmericanCentral American IndianCherokeeCheyenneChickasawChileanChineseChippewaChoctawColombianColvilleComancheCosta RicanCreeCreekCroatianCrowCubanCypriotCzechCzechoslovakianDanishDelawareDominicanDutchDutch West IndianEastern EuropeanEcuadorianEgyptianEnglishEstonianEthiopianEuropeanFijianFilipinoFinnishFrenchFrench American IndianFrench CanadianGermanGerman RussianGhanaianGreekGuamanian/ChamorroGuatemalanGuyaneseHaitianHmongHonduranHopiHoumaHungarianIcelanderIndian (Asian)IndonesianInupiatIranianIraqiIrishIroquoisIsraeliItalianJamaicanJapaneseJordanianKenyanKiowaKoreanLaotianLatvianLebaneseLiberianLithuanianLumbeeLuxembourgerMacedonianMalaysianMalteseMarshalleseMenomineeMexicanMexican American IndianMongolianMoroccanNative HawaiianNavajoNepaleseNew ZealanderNicaraguanNigerianNorthern EuropeanNorwegianOkinawanOsageOttawaPaiutePakistaniPalestinianPanamanianParaguayanPennsylvania GermanPeruvianPimaPolishPortuguesePotawatomiPuebloPuerto RicanPuget Sound SalishRomanianRussianSalvadoranSamoanScandinavianScotch-IrishScottishSeminoleSenegaleseSerbianShoshoneSierra LeoneanSiouxSlavicSlovakSloveneSomaliSouth AfricanSouth AmericanSouth American IndianSoviet UnionSpaniardSpanishSpanish AmericanSpanish American IndianSri LankanSubsaharan AfricanSudaneseSwedishSwissSyrianTaiwaneseThaiTlingit-HaidaTohono O'OdhamTonganTrinidadian and TobagonianTsimshianTurkishU.S. Virgin IslanderUgandanUkrainianUruguayanUteVenezuelanVietnameseWelshWest IndianYakamaYaquiYugoslavianYumanYup'ikZimbabwean
Immigration
NonimmigrantsImmigrantsAfghanistanAfricaAlbaniaArgentinaArmeniaAsiaAustraliaAustriaBahamasBangladeshBarbadosBelarusBelgiumBelizeBoliviaBosnia and HerzegovinaBrazilBulgariaBurma/MyanmarCabo VerdeCambodiaCameroonCanadaCaribbeanCentral AmericaChileChinaColombiaCongoCosta RicaCroatiaCubaCzechoslovakiaDenmarkDominicaDominican RepublicEastern AfricaEastern AsiaEastern EuropeEcuadorEgyptEl SalvadorEnglandEritreaEthiopiaEuropeFijiFranceGermanyGhanaGreeceGrenadaGuatemalaGuyanaHaitiHondurasHong KongHungaryIndiaIndonesiaIranIraqIrelandIsraelItalyJamaicaJapanJordanKazakhstanKenyaKoreaKuwaitLaosLatin AmericaLatviaLebanonLiberiaLithuaniaMalaysiaMexicoMicronesiaMiddle AfricaMoldovaMoroccoNepalNetherlandsNicaraguaNigeriaNorth AmericaNorth MacedoniaNorthern AfricaNorthern EuropeNorwayOceaniaPakistanPanamaPeruPhilippinesPolandPortugalRussiaSaudi ArabiaScotlandSenegalSerbiaSierra LeoneSingaporeSomaliaSouth AfricaSouth AmericaSouth Central AsiaSouth Eastern AsiaSouthern EuropeSpainSri LankaSt. Vincent and the GrenadinesSudanSwedenSwitzerlandSyriaTaiwanThailandTrinidad and TobagoTurkeyUgandaUkraineUruguayUzbekistanVenezuelaVietnamWest IndiesWestern AfricaWestern AsiaWestern EuropeYemenZaireZimbabweAzores
Immigrants from Romania
Race
Ancestry
AfghanAfricanAlaska NativeAlaskan AthabascanAlbanianAleutAlsatianAmericanApacheArabArapahoArgentineanArmenianAssyrian/Chaldean/SyriacAustralianAustrianBahamianBangladeshiBarbadianBasqueBelgianBelizeanBermudanBhutaneseBlackfeetBolivianBrazilianBritishBritish West IndianBulgarianBurmeseCajunCambodianCanadianCape VerdeanCarpatho RusynCelticCentral AmericanCentral American IndianCherokeeCheyenneChickasawChileanChineseChippewaChoctawColombianColvilleComancheCosta RicanCreeCreekCroatianCrowCubanCypriotCzechCzechoslovakianDanishDelawareDominicanDutchDutch West IndianEastern EuropeanEcuadorianEgyptianEnglishEstonianEthiopianEuropeanFijianFilipinoFinnishFrenchFrench American IndianFrench CanadianGermanGerman RussianGhanaianGreekGuamanian/ChamorroGuatemalanGuyaneseHaitianHmongHonduranHopiHoumaHungarianIcelanderIndian (Asian)IndonesianInupiatIranianIraqiIrishIroquoisIsraeliItalianJamaicanJapaneseJordanianKenyanKiowaKoreanLaotianLatvianLebaneseLiberianLithuanianLumbeeLuxembourgerMacedonianMalaysianMalteseMarshalleseMenomineeMexicanMexican American IndianMongolianMoroccanNative HawaiianNavajoNepaleseNew ZealanderNicaraguanNigerianNorthern EuropeanNorwegianOkinawanOsageOttawaPaiutePakistaniPalestinianPanamanianParaguayanPennsylvania GermanPeruvianPimaPolishPortuguesePotawatomiPuebloPuerto RicanPuget Sound SalishRomanianRussianSalvadoranSamoanScandinavianScotch-IrishScottishSeminoleSenegaleseSerbianShoshoneSierra LeoneanSiouxSlavicSlovakSloveneSomaliSouth AfricanSouth AmericanSouth American IndianSoviet UnionSpaniardSpanishSpanish AmericanSpanish American IndianSri LankanSubsaharan AfricanSudaneseSwedishSwissSyrianTaiwaneseThaiTlingit-HaidaTohono O'OdhamTonganTrinidadian and TobagonianTsimshianTurkishU.S. Virgin IslanderUgandanUkrainianUruguayanUteVenezuelanVietnameseWelshWest IndianYakamaYaquiYugoslavianYumanYup'ikZimbabwean
Immigration
NonimmigrantsImmigrantsAfricaAlbaniaArgentinaArmeniaAsiaAustraliaAustriaBahamasBangladeshBarbadosBelarusBelgiumBelizeBoliviaBosnia and HerzegovinaBrazilBulgariaBurma/MyanmarCabo VerdeCambodiaCameroonCanadaCaribbeanCentral AmericaChileChinaColombiaCongoCosta RicaCroatiaCubaCzechoslovakiaDenmarkDominicaDominican RepublicEastern AfricaEastern AsiaEastern EuropeEcuadorEgyptEl SalvadorEnglandEritreaEthiopiaEuropeFijiFranceGermanyGhanaGreeceGrenadaGuatemalaGuyanaHaitiHondurasHong KongHungaryIndiaIndonesiaIranIraqIrelandIsraelItalyJamaicaJapanJordanKazakhstanKenyaKoreaKuwaitLaosLatin AmericaLatviaLebanonLiberiaLithuaniaMalaysiaMexicoMicronesiaMiddle AfricaMoldovaMoroccoNepalNetherlandsNicaraguaNigeriaNorth AmericaNorth MacedoniaNorthern AfricaNorthern EuropeNorwayOceaniaPakistanPanamaPeruPhilippinesPolandPortugalRomaniaRussiaSaudi ArabiaScotlandSenegalSerbiaSierra LeoneSingaporeSomaliaSouth AfricaSouth AmericaSouth Central AsiaSouth Eastern AsiaSouthern EuropeSpainSri LankaSt. Vincent and the GrenadinesSudanSwedenSwitzerlandSyriaTaiwanThailandTrinidad and TobagoTurkeyUgandaUkraineUruguayUzbekistanVenezuelaVietnamWest IndiesWestern AfricaWestern AsiaWestern EuropeYemenZaireZimbabweAzores
Householder Income Ages 25 - 44 years
Income
Poverty
Unemployment
Labor Participation
Family Structure
Vehicle Availability
Education Level
Disability

Householder Income Ages 25 - 44 years Comparison

Immigrants from Afghanistan

Immigrants from Romania

Exceptional
Exceptional
$99,977
HOUSEHOLDER INCOME AGES 25 - 44 YEARS
95.3/ 100
METRIC RATING
110th/ 347
METRIC RANK
$104,713
HOUSEHOLDER INCOME AGES 25 - 44 YEARS
99.6/ 100
METRIC RATING
67th/ 347
METRIC RANK

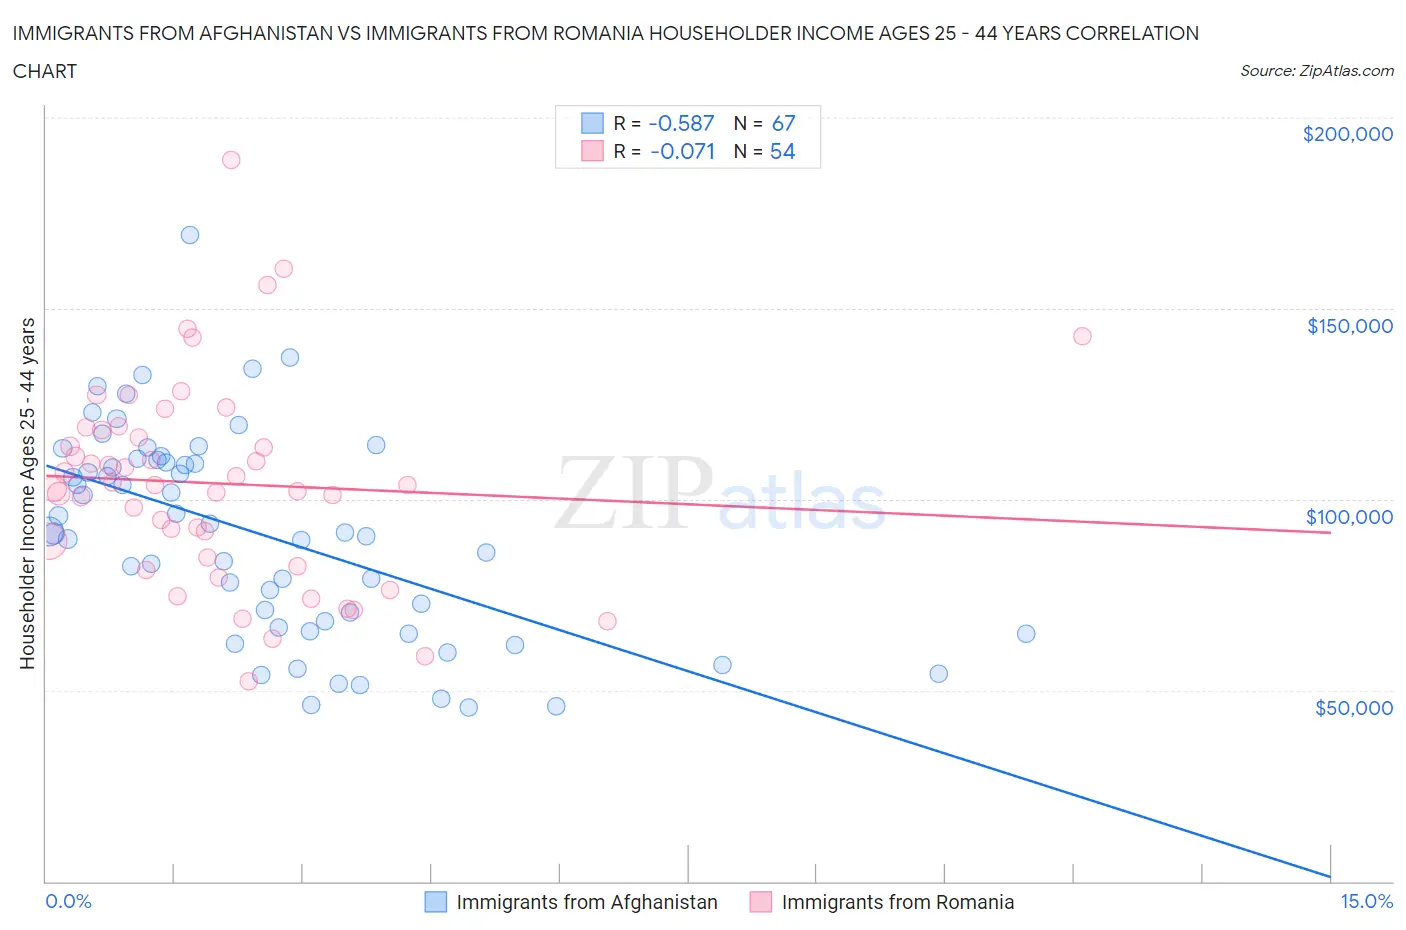
Immigrants from Afghanistan vs Immigrants from Romania Householder Income Ages 25 - 44 years Correlation Chart

The statistical analysis conducted on geographies consisting of 147,550,415 people shows a substantial negative correlation between the proportion of Immigrants from Afghanistan and household income with householder between the ages 25 and 44 in the United States with a correlation coefficient (R) of -0.587 and weighted average of $99,977. Similarly, the statistical analysis conducted on geographies consisting of 256,633,745 people shows a slight negative correlation between the proportion of Immigrants from Romania and household income with householder between the ages 25 and 44 in the United States with a correlation coefficient (R) of -0.071 and weighted average of $104,713, a difference of 4.7%.
Immigrants from Afghanistan vs Immigrants from Romania Householder Income Ages 25 - 44 years

Householder Income Ages 25 - 44 years Correlation Summary

MeasurementImmigrants from AfghanistanImmigrants from Romania
Minimum$45,625$52,260
Maximum$169,252$188,943
Range$123,627$136,683
Mean$90,836$104,157
Median$91,322$103,726
Interquartile 25% (IQ1)$66,441$84,716
Interquartile 75% (IQ3)$110,235$118,244
Interquartile Range (IQR)$43,794$33,528
Standard Deviation (Sample)$27,071$26,678
Standard Deviation (Population)$26,868$26,430

Similar Demographics by Householder Income Ages 25 - 44 years

Demographics Similar to Immigrants from Afghanistan by Householder Income Ages 25 - 44 years

In terms of householder income ages 25 - 44 years, the demographic groups most similar to Immigrants from Afghanistan are Chilean ($99,900, a difference of 0.080%), Immigrants from North Macedonia ($100,101, a difference of 0.12%), Polish ($99,685, a difference of 0.29%), Immigrants from South Eastern Asia ($100,283, a difference of 0.31%), and Tongan ($99,604, a difference of 0.37%).
DemographicsRating | RankHouseholder Income Ages 25 - 44 years
Immigrants | Moldova
97.4
/100
|
#103
Exceptional
$101,091
Immigrants | Poland
97.4
/100
|
#104
Exceptional
$101,065
Immigrants | Vietnam
96.5
/100
|
#105
Exceptional
$100,535
Immigrants | Brazil
96.5
/100
|
#106
Exceptional
$100,534
Northern Europeans
96.3
/100
|
#107
Exceptional
$100,457
Immigrants | South Eastern Asia
96.0
/100
|
#108
Exceptional
$100,283
Immigrants | North Macedonia
95.6
/100
|
#109
Exceptional
$100,101
Immigrants | Afghanistan
95.3
/100
|
#110
Exceptional
$99,977
Chileans
95.1
/100
|
#111
Exceptional
$99,900
Poles
94.5
/100
|
#112
Exceptional
$99,685
Tongans
94.2
/100
|
#113
Exceptional
$99,604
Immigrants | Western Asia
94.0
/100
|
#114
Exceptional
$99,516
Carpatho Rusyns
93.7
/100
|
#115
Exceptional
$99,449
Portuguese
93.7
/100
|
#116
Exceptional
$99,429
Immigrants | Northern Africa
93.0
/100
|
#117
Exceptional
$99,232

Demographics Similar to Immigrants from Romania by Householder Income Ages 25 - 44 years

In terms of householder income ages 25 - 44 years, the demographic groups most similar to Immigrants from Romania are Immigrants from Eastern Europe ($104,662, a difference of 0.050%), Mongolian ($104,578, a difference of 0.13%), Immigrants from Croatia ($104,503, a difference of 0.20%), Laotian ($104,993, a difference of 0.27%), and Afghan ($104,410, a difference of 0.29%).
DemographicsRating | RankHouseholder Income Ages 25 - 44 years
Egyptians
99.7
/100
|
#60
Exceptional
$105,282
Lithuanians
99.7
/100
|
#61
Exceptional
$105,223
Immigrants | Italy
99.7
/100
|
#62
Exceptional
$105,201
Immigrants | Scotland
99.7
/100
|
#63
Exceptional
$105,089
New Zealanders
99.7
/100
|
#64
Exceptional
$105,085
Immigrants | Netherlands
99.7
/100
|
#65
Exceptional
$105,082
Laotians
99.7
/100
|
#66
Exceptional
$104,993
Immigrants | Romania
99.6
/100
|
#67
Exceptional
$104,713
Immigrants | Eastern Europe
99.6
/100
|
#68
Exceptional
$104,662
Mongolians
99.6
/100
|
#69
Exceptional
$104,578
Immigrants | Croatia
99.6
/100
|
#70
Exceptional
$104,503
Afghans
99.6
/100
|
#71
Exceptional
$104,410
Chinese
99.5
/100
|
#72
Exceptional
$104,264
Italians
99.5
/100
|
#73
Exceptional
$104,215
Immigrants | Fiji
99.5
/100
|
#74
Exceptional
$103,954