Icelander vs Northern European Median Female Earnings
COMPARE
Icelander
Northern European
Median Female Earnings
Median Female Earnings Comparison
Icelanders
Northern Europeans
$39,109
MEDIAN FEMALE EARNINGS
22.7/ 100
METRIC RATING
199th/ 347
METRIC RANK
$40,491
MEDIAN FEMALE EARNINGS
83.9/ 100
METRIC RATING
143rd/ 347
METRIC RANK
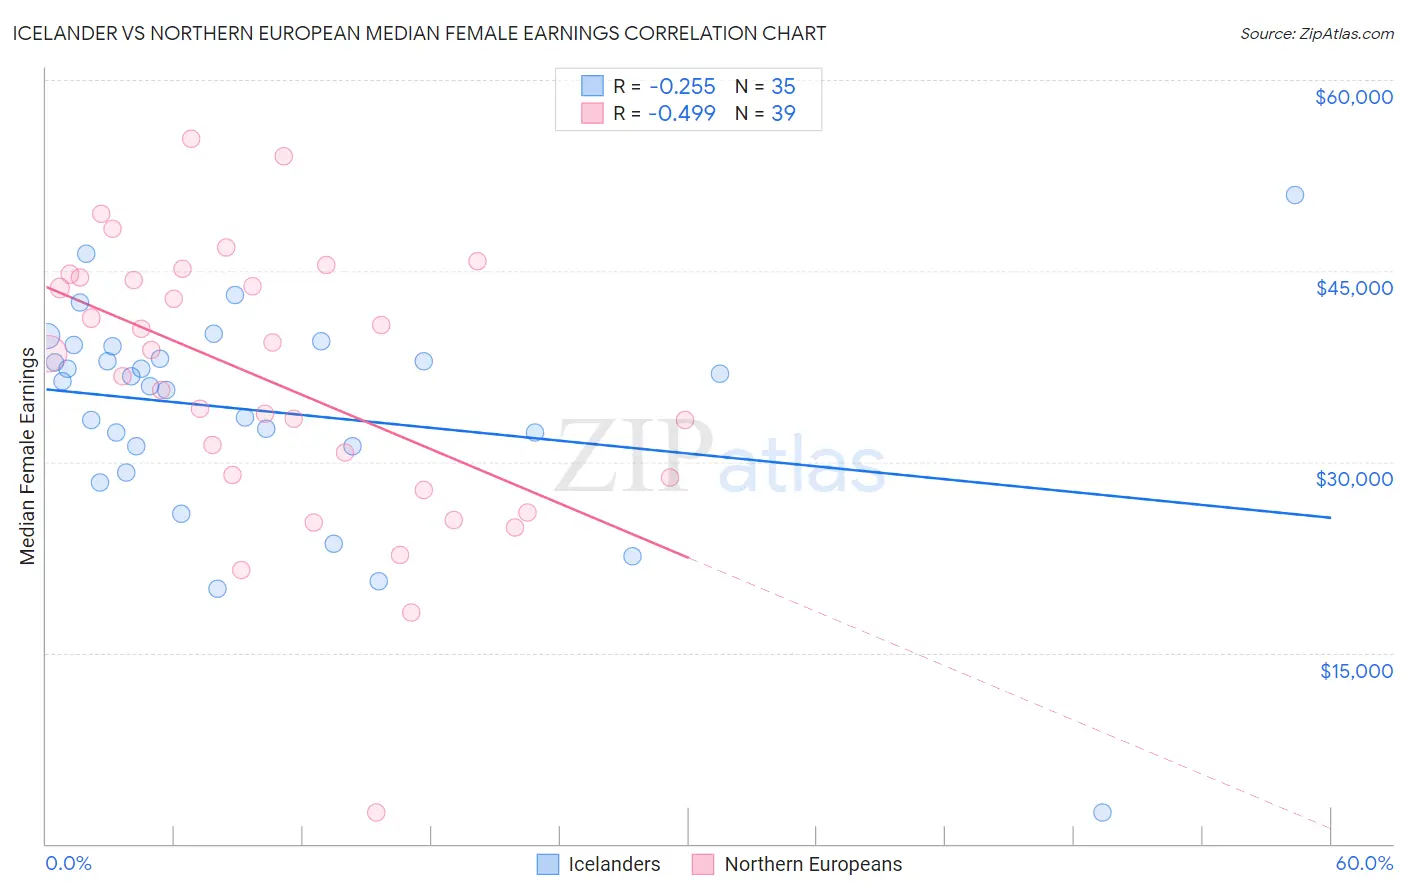
Icelander vs Northern European Median Female Earnings Correlation Chart
The statistical analysis conducted on geographies consisting of 159,641,354 people shows a weak negative correlation between the proportion of Icelanders and median female earnings in the United States with a correlation coefficient (R) of -0.255 and weighted average of $39,109. Similarly, the statistical analysis conducted on geographies consisting of 405,763,139 people shows a moderate negative correlation between the proportion of Northern Europeans and median female earnings in the United States with a correlation coefficient (R) of -0.499 and weighted average of $40,491, a difference of 3.5%.
Median Female Earnings Correlation Summary
| Measurement | Icelander | Northern European |
| Minimum | $2,499 | $2,499 |
| Maximum | $50,938 | $55,429 |
| Range | $48,439 | $52,930 |
| Mean | $33,934 | $36,265 |
| Median | $36,326 | $38,502 |
| Interquartile 25% (IQ1) | $31,250 | $28,750 |
| Interquartile 75% (IQ3) | $39,051 | $44,474 |
| Interquartile Range (IQR) | $7,801 | $15,724 |
| Standard Deviation (Sample) | $8,758 | $10,785 |
| Standard Deviation (Population) | $8,632 | $10,645 |
Similar Demographics by Median Female Earnings
Demographics Similar to Icelanders by Median Female Earnings
In terms of median female earnings, the demographic groups most similar to Icelanders are Ecuadorian ($39,117, a difference of 0.020%), Assyrian/Chaldean/Syriac ($39,159, a difference of 0.13%), Immigrants from Panama ($39,049, a difference of 0.15%), Panamanian ($39,049, a difference of 0.15%), and Immigrants from Costa Rica ($39,186, a difference of 0.20%).
| Demographics | Rating | Rank | Median Female Earnings |
| Immigrants | Immigrants | 31.7 /100 | #192 | Fair $39,328 |
| Immigrants | Nigeria | 30.2 /100 | #193 | Fair $39,294 |
| Irish | 30.0 /100 | #194 | Fair $39,291 |
| Uruguayans | 27.3 /100 | #195 | Fair $39,228 |
| Immigrants | Costa Rica | 25.6 /100 | #196 | Fair $39,186 |
| Assyrians/Chaldeans/Syriacs | 24.6 /100 | #197 | Fair $39,159 |
| Ecuadorians | 23.0 /100 | #198 | Fair $39,117 |
| Icelanders | 22.7 /100 | #199 | Fair $39,109 |
| Immigrants | Panama | 20.6 /100 | #200 | Fair $39,049 |
| Panamanians | 20.6 /100 | #201 | Fair $39,049 |
| Slovaks | 19.9 /100 | #202 | Poor $39,029 |
| Czechs | 18.7 /100 | #203 | Poor $38,992 |
| Immigrants | Uruguay | 17.3 /100 | #204 | Poor $38,945 |
| Immigrants | Colombia | 16.3 /100 | #205 | Poor $38,913 |
| Immigrants | Bosnia and Herzegovina | 15.6 /100 | #206 | Poor $38,886 |
Demographics Similar to Northern Europeans by Median Female Earnings
In terms of median female earnings, the demographic groups most similar to Northern Europeans are Sri Lankan ($40,496, a difference of 0.010%), Immigrants from North Macedonia ($40,488, a difference of 0.010%), Immigrants from Syria ($40,499, a difference of 0.020%), Brazilian ($40,483, a difference of 0.020%), and Serbian ($40,539, a difference of 0.12%).
| Demographics | Rating | Rank | Median Female Earnings |
| Immigrants | Eastern Africa | 87.7 /100 | #136 | Excellent $40,644 |
| Pakistanis | 86.6 /100 | #137 | Excellent $40,596 |
| Taiwanese | 86.1 /100 | #138 | Excellent $40,576 |
| Immigrants | South Eastern Asia | 85.7 /100 | #139 | Excellent $40,558 |
| Serbians | 85.2 /100 | #140 | Excellent $40,539 |
| Immigrants | Syria | 84.1 /100 | #141 | Excellent $40,499 |
| Sri Lankans | 84.0 /100 | #142 | Excellent $40,496 |
| Northern Europeans | 83.9 /100 | #143 | Excellent $40,491 |
| Immigrants | North Macedonia | 83.8 /100 | #144 | Excellent $40,488 |
| Brazilians | 83.6 /100 | #145 | Excellent $40,483 |
| Ghanaians | 82.1 /100 | #146 | Excellent $40,429 |
| Vietnamese | 80.4 /100 | #147 | Excellent $40,377 |
| Poles | 80.2 /100 | #148 | Excellent $40,371 |
| Immigrants | Cameroon | 79.7 /100 | #149 | Good $40,354 |
| Immigrants | Chile | 79.6 /100 | #150 | Good $40,353 |