Icelander vs Immigrants from Bolivia Median Family Income
COMPARE
Icelander
Immigrants from Bolivia
Median Family Income
Median Family Income Comparison
Icelanders
Immigrants from Bolivia
$104,282
MEDIAN FAMILY INCOME
69.4/ 100
METRIC RATING
161st/ 347
METRIC RANK
$117,912
MEDIAN FAMILY INCOME
100.0/ 100
METRIC RATING
42nd/ 347
METRIC RANK
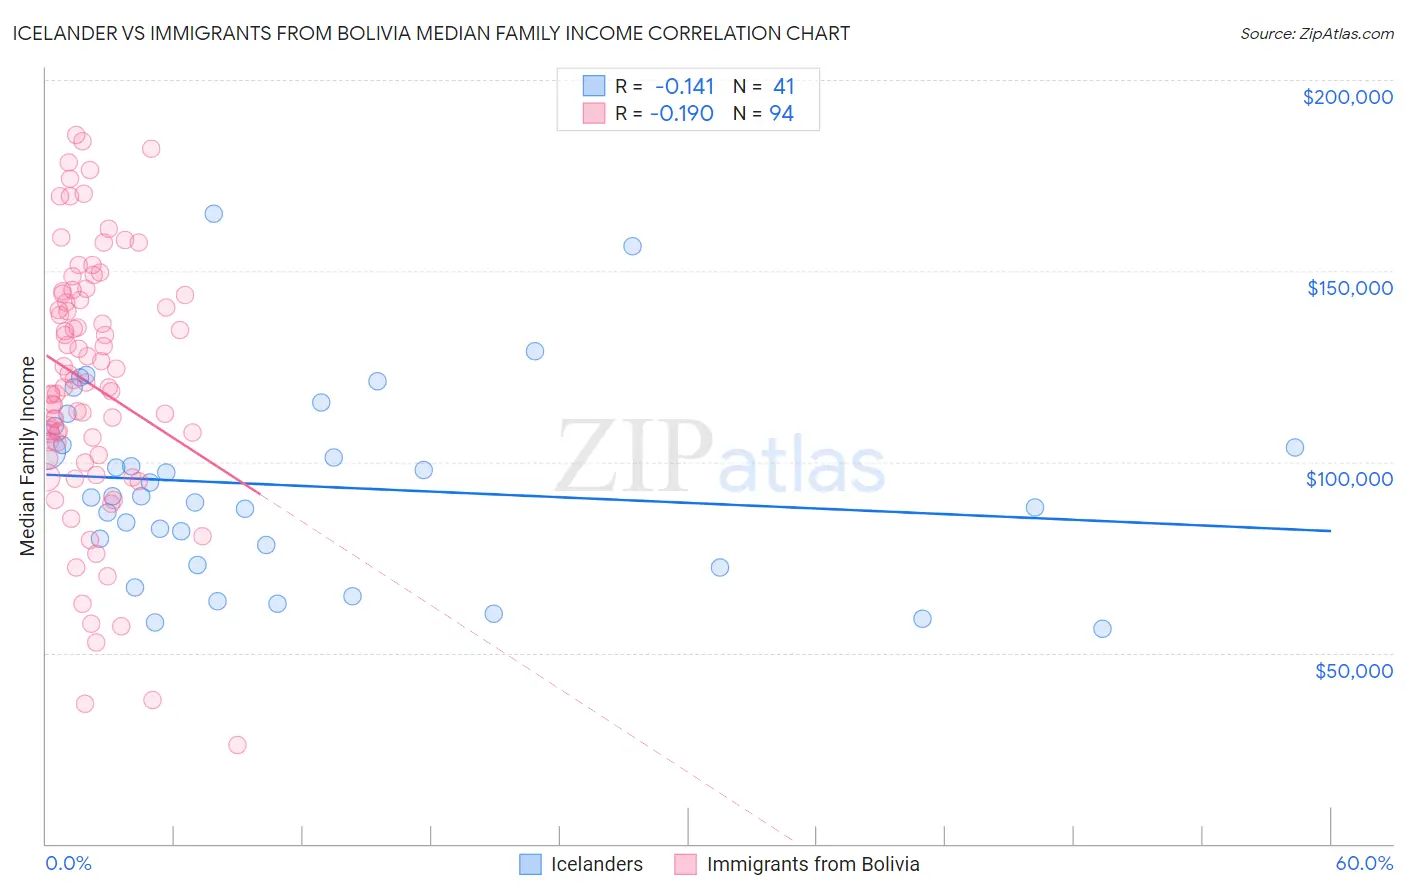
Icelander vs Immigrants from Bolivia Median Family Income Correlation Chart
The statistical analysis conducted on geographies consisting of 159,597,543 people shows a poor negative correlation between the proportion of Icelanders and median family income in the United States with a correlation coefficient (R) of -0.141 and weighted average of $104,282. Similarly, the statistical analysis conducted on geographies consisting of 158,713,434 people shows a poor negative correlation between the proportion of Immigrants from Bolivia and median family income in the United States with a correlation coefficient (R) of -0.190 and weighted average of $117,912, a difference of 13.1%.
Median Family Income Correlation Summary
| Measurement | Icelander | Immigrants from Bolivia |
| Minimum | $56,250 | $25,703 |
| Maximum | $165,003 | $185,567 |
| Range | $108,753 | $159,864 |
| Mean | $93,671 | $120,434 |
| Median | $90,899 | $120,122 |
| Interquartile 25% (IQ1) | $75,543 | $101,733 |
| Interquartile 75% (IQ3) | $106,880 | $143,542 |
| Interquartile Range (IQR) | $31,337 | $41,809 |
| Standard Deviation (Sample) | $25,058 | $33,861 |
| Standard Deviation (Population) | $24,750 | $33,681 |
Similar Demographics by Median Family Income
Demographics Similar to Icelanders by Median Family Income
In terms of median family income, the demographic groups most similar to Icelanders are Scottish ($104,288, a difference of 0.010%), Swiss ($104,396, a difference of 0.11%), Scandinavian ($104,410, a difference of 0.12%), Moroccan ($104,488, a difference of 0.20%), and Immigrants from Sierra Leone ($103,990, a difference of 0.28%).
| Demographics | Rating | Rank | Median Family Income |
| Immigrants | Nepal | 76.3 /100 | #154 | Good $104,966 |
| Native Hawaiians | 75.8 /100 | #155 | Good $104,910 |
| Basques | 74.4 /100 | #156 | Good $104,760 |
| Moroccans | 71.6 /100 | #157 | Good $104,488 |
| Scandinavians | 70.8 /100 | #158 | Good $104,410 |
| Swiss | 70.7 /100 | #159 | Good $104,396 |
| Scottish | 69.5 /100 | #160 | Good $104,288 |
| Icelanders | 69.4 /100 | #161 | Good $104,282 |
| Immigrants | Sierra Leone | 66.2 /100 | #162 | Good $103,990 |
| Costa Ricans | 66.2 /100 | #163 | Good $103,989 |
| Sierra Leoneans | 64.7 /100 | #164 | Good $103,859 |
| Slovaks | 63.1 /100 | #165 | Good $103,729 |
| English | 62.6 /100 | #166 | Good $103,684 |
| South American Indians | 61.9 /100 | #167 | Good $103,624 |
| Immigrants | Peru | 60.8 /100 | #168 | Good $103,534 |
Demographics Similar to Immigrants from Bolivia by Median Family Income
In terms of median family income, the demographic groups most similar to Immigrants from Bolivia are Bulgarian ($117,818, a difference of 0.080%), Estonian ($118,013, a difference of 0.090%), Cambodian ($117,780, a difference of 0.11%), Immigrants from Lithuania ($118,053, a difference of 0.12%), and Immigrants from Asia ($118,291, a difference of 0.32%).
| Demographics | Rating | Rank | Median Family Income |
| Soviet Union | 100.0 /100 | #35 | Exceptional $119,262 |
| Israelis | 100.0 /100 | #36 | Exceptional $118,577 |
| Australians | 100.0 /100 | #37 | Exceptional $118,440 |
| Immigrants | Turkey | 100.0 /100 | #38 | Exceptional $118,325 |
| Immigrants | Asia | 100.0 /100 | #39 | Exceptional $118,291 |
| Immigrants | Lithuania | 100.0 /100 | #40 | Exceptional $118,053 |
| Estonians | 100.0 /100 | #41 | Exceptional $118,013 |
| Immigrants | Bolivia | 100.0 /100 | #42 | Exceptional $117,912 |
| Bulgarians | 100.0 /100 | #43 | Exceptional $117,818 |
| Cambodians | 100.0 /100 | #44 | Exceptional $117,780 |
| Immigrants | Greece | 99.9 /100 | #45 | Exceptional $117,344 |
| Immigrants | Russia | 99.9 /100 | #46 | Exceptional $116,942 |
| Immigrants | Austria | 99.9 /100 | #47 | Exceptional $116,830 |
| Immigrants | South Africa | 99.9 /100 | #48 | Exceptional $116,286 |
| Chinese | 99.9 /100 | #49 | Exceptional $116,188 |