Hungarian vs Venezuelan Householder Income Under 25 years
COMPARE
Hungarian
Venezuelan
Householder Income Under 25 years
Householder Income Under 25 years Comparison
Hungarians
Venezuelans
$50,247
HOUSEHOLDER INCOME UNDER 25 YEARS
0.9/ 100
METRIC RATING
261st/ 347
METRIC RANK
$50,011
HOUSEHOLDER INCOME UNDER 25 YEARS
0.5/ 100
METRIC RATING
268th/ 347
METRIC RANK
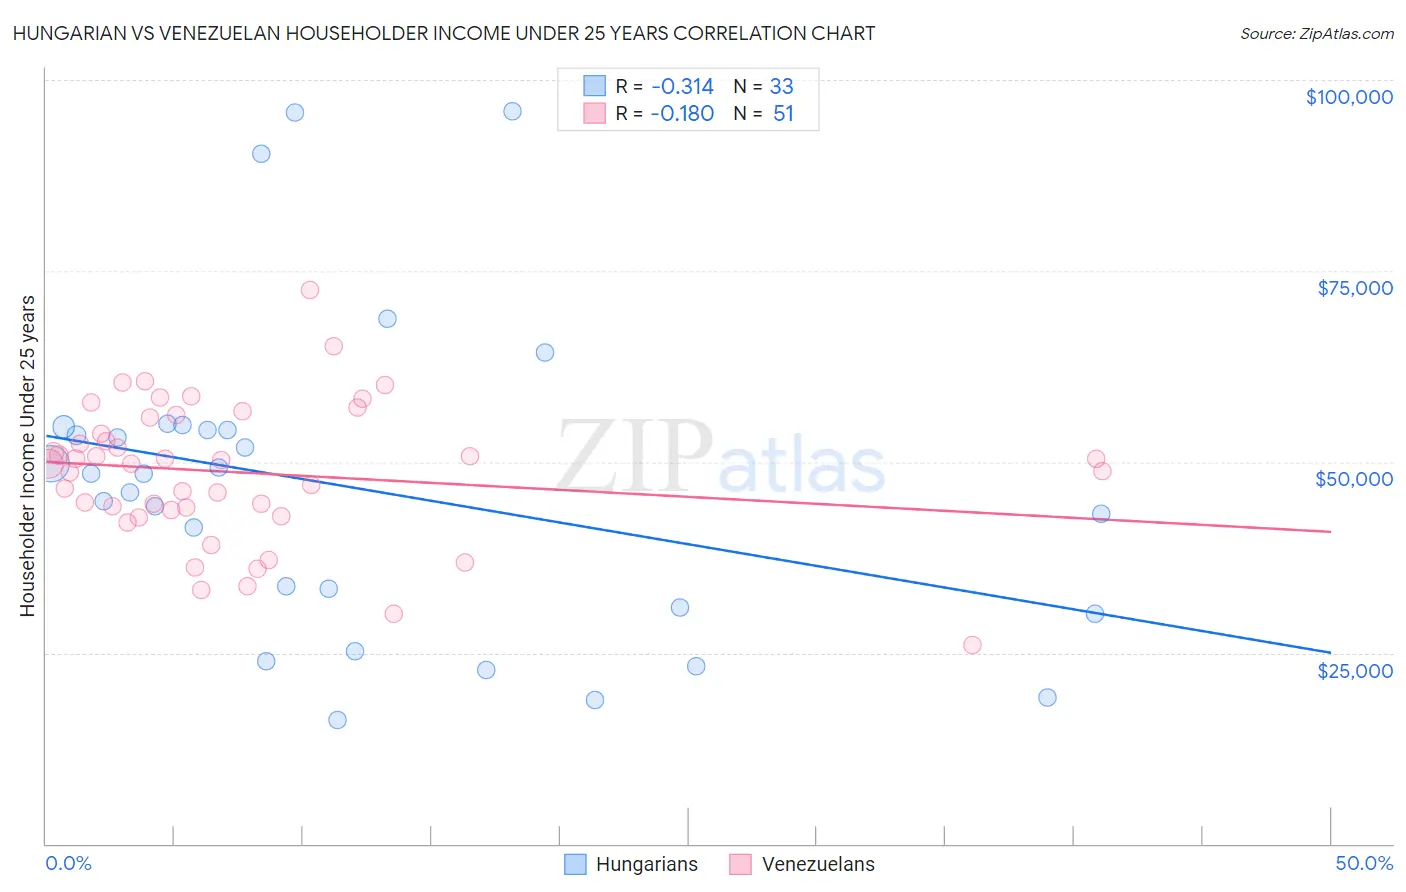
Hungarian vs Venezuelan Householder Income Under 25 years Correlation Chart
The statistical analysis conducted on geographies consisting of 392,087,148 people shows a mild negative correlation between the proportion of Hungarians and household income with householder under the age of 25 in the United States with a correlation coefficient (R) of -0.314 and weighted average of $50,247. Similarly, the statistical analysis conducted on geographies consisting of 267,458,275 people shows a poor negative correlation between the proportion of Venezuelans and household income with householder under the age of 25 in the United States with a correlation coefficient (R) of -0.180 and weighted average of $50,011, a difference of 0.47%.
Householder Income Under 25 years Correlation Summary
| Measurement | Hungarian | Venezuelan |
| Minimum | $16,220 | $26,011 |
| Maximum | $95,845 | $72,500 |
| Range | $79,625 | $46,489 |
| Mean | $46,639 | $48,579 |
| Median | $48,413 | $49,832 |
| Interquartile 25% (IQ1) | $30,495 | $43,664 |
| Interquartile 75% (IQ3) | $54,364 | $55,823 |
| Interquartile Range (IQR) | $23,869 | $12,159 |
| Standard Deviation (Sample) | $20,516 | $9,174 |
| Standard Deviation (Population) | $20,203 | $9,084 |
Demographics Similar to Hungarians and Venezuelans by Householder Income Under 25 years
In terms of householder income under 25 years, the demographic groups most similar to Hungarians are Haitian ($50,231, a difference of 0.030%), Hispanic or Latino ($50,279, a difference of 0.060%), Immigrants from Dominican Republic ($50,204, a difference of 0.090%), Immigrants from Dominica ($50,301, a difference of 0.11%), and White/Caucasian ($50,336, a difference of 0.18%). Similarly, the demographic groups most similar to Venezuelans are Ute ($49,997, a difference of 0.030%), Mexican ($49,989, a difference of 0.040%), Immigrants from Laos ($50,041, a difference of 0.060%), Immigrants from Venezuela ($50,109, a difference of 0.19%), and Belgian ($50,113, a difference of 0.20%).
| Demographics | Rating | Rank | Householder Income Under 25 years |
| Luxembourgers | 1.2 /100 | #254 | Tragic $50,379 |
| Aleuts | 1.2 /100 | #255 | Tragic $50,377 |
| Immigrants | Cuba | 1.2 /100 | #256 | Tragic $50,374 |
| Lebanese | 1.1 /100 | #257 | Tragic $50,355 |
| Whites/Caucasians | 1.1 /100 | #258 | Tragic $50,336 |
| Immigrants | Dominica | 1.0 /100 | #259 | Tragic $50,301 |
| Hispanics or Latinos | 0.9 /100 | #260 | Tragic $50,279 |
| Hungarians | 0.9 /100 | #261 | Tragic $50,247 |
| Haitians | 0.8 /100 | #262 | Tragic $50,231 |
| Immigrants | Dominican Republic | 0.8 /100 | #263 | Tragic $50,204 |
| Fijians | 0.6 /100 | #264 | Tragic $50,132 |
| Belgians | 0.6 /100 | #265 | Tragic $50,113 |
| Immigrants | Venezuela | 0.6 /100 | #266 | Tragic $50,109 |
| Immigrants | Laos | 0.5 /100 | #267 | Tragic $50,041 |
| Venezuelans | 0.5 /100 | #268 | Tragic $50,011 |
| Ute | 0.5 /100 | #269 | Tragic $49,997 |
| Mexicans | 0.5 /100 | #270 | Tragic $49,989 |
| Taiwanese | 0.3 /100 | #271 | Tragic $49,804 |
| Colville | 0.3 /100 | #272 | Tragic $49,774 |
| Slovaks | 0.3 /100 | #273 | Tragic $49,753 |
| Immigrants | Senegal | 0.3 /100 | #274 | Tragic $49,742 |