Hungarian vs Immigrants from Northern Europe Median Earnings
COMPARE
Hungarian
Immigrants from Northern Europe
Median Earnings
Median Earnings Comparison
Hungarians
Immigrants from Northern Europe
$47,795
MEDIAN EARNINGS
87.1/ 100
METRIC RATING
144th/ 347
METRIC RANK
$53,872
MEDIAN EARNINGS
100.0/ 100
METRIC RATING
26th/ 347
METRIC RANK
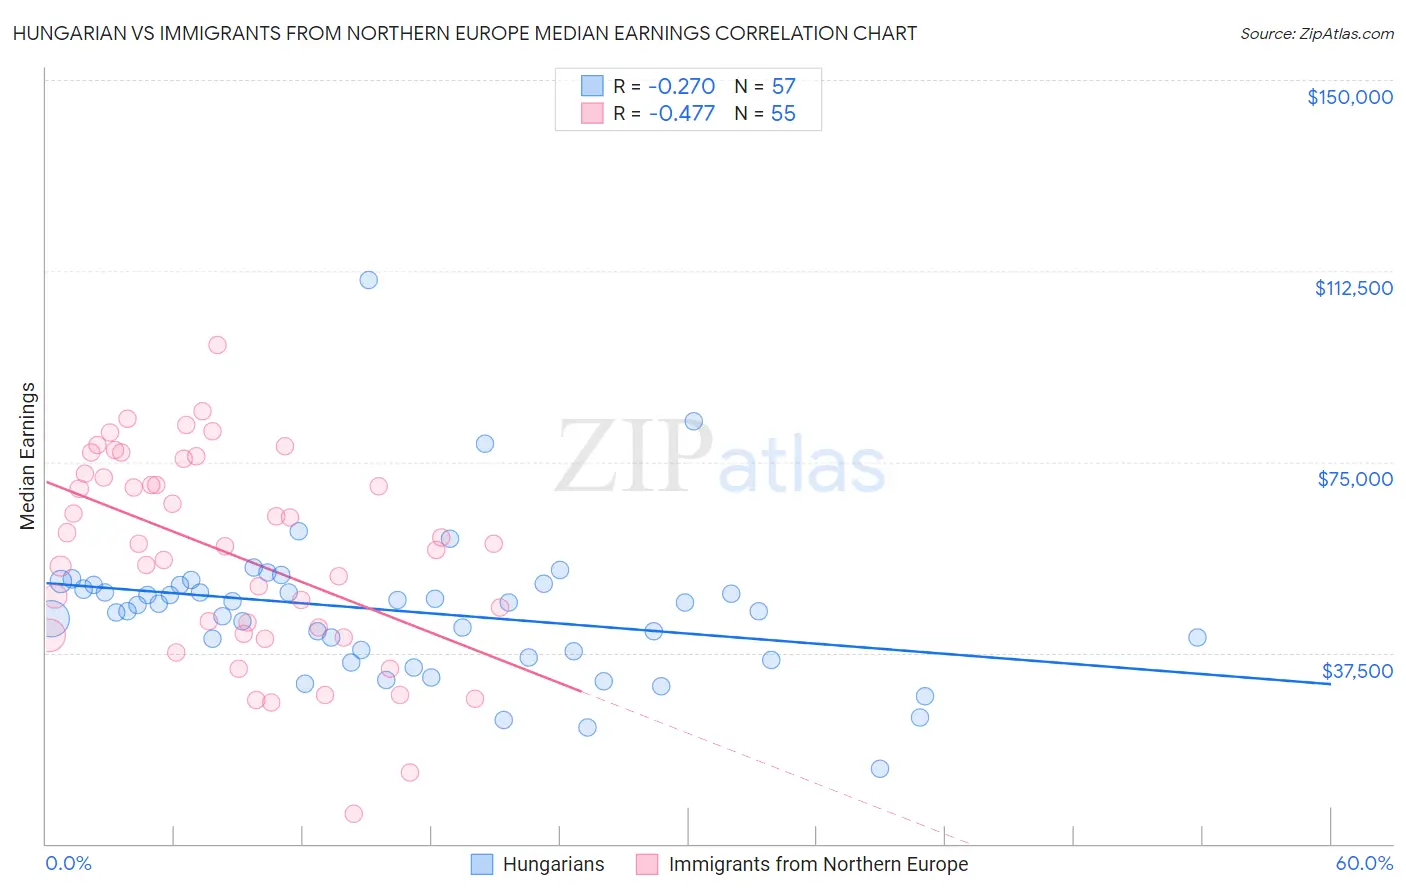
Hungarian vs Immigrants from Northern Europe Median Earnings Correlation Chart
The statistical analysis conducted on geographies consisting of 486,158,969 people shows a weak negative correlation between the proportion of Hungarians and median earnings in the United States with a correlation coefficient (R) of -0.270 and weighted average of $47,795. Similarly, the statistical analysis conducted on geographies consisting of 477,145,093 people shows a moderate negative correlation between the proportion of Immigrants from Northern Europe and median earnings in the United States with a correlation coefficient (R) of -0.477 and weighted average of $53,872, a difference of 12.7%.
Median Earnings Correlation Summary
| Measurement | Hungarian | Immigrants from Northern Europe |
| Minimum | $14,721 | $5,997 |
| Maximum | $110,790 | $98,000 |
| Range | $96,069 | $92,003 |
| Mean | $45,677 | $56,961 |
| Median | $46,823 | $58,943 |
| Interquartile 25% (IQ1) | $37,180 | $41,349 |
| Interquartile 75% (IQ3) | $50,813 | $72,683 |
| Interquartile Range (IQR) | $13,633 | $31,335 |
| Standard Deviation (Sample) | $14,634 | $19,840 |
| Standard Deviation (Population) | $14,505 | $19,659 |
Similar Demographics by Median Earnings
Demographics Similar to Hungarians by Median Earnings
In terms of median earnings, the demographic groups most similar to Hungarians are Ugandan ($47,854, a difference of 0.12%), Swedish ($47,851, a difference of 0.12%), Immigrants from Sierra Leone ($47,875, a difference of 0.17%), Immigrants from Saudi Arabia ($47,704, a difference of 0.19%), and Immigrants from Chile ($47,697, a difference of 0.21%).
| Demographics | Rating | Rank | Median Earnings |
| Immigrants | Nepal | 89.0 /100 | #137 | Excellent $47,925 |
| Europeans | 88.9 /100 | #138 | Excellent $47,915 |
| Canadians | 88.8 /100 | #139 | Excellent $47,911 |
| Taiwanese | 88.7 /100 | #140 | Excellent $47,902 |
| Immigrants | Sierra Leone | 88.3 /100 | #141 | Excellent $47,875 |
| Ugandans | 88.0 /100 | #142 | Excellent $47,854 |
| Swedes | 88.0 /100 | #143 | Excellent $47,851 |
| Hungarians | 87.1 /100 | #144 | Excellent $47,795 |
| Immigrants | Saudi Arabia | 85.6 /100 | #145 | Excellent $47,704 |
| Immigrants | Chile | 85.5 /100 | #146 | Excellent $47,697 |
| Immigrants | South Eastern Asia | 85.0 /100 | #147 | Excellent $47,671 |
| Immigrants | Eritrea | 84.8 /100 | #148 | Excellent $47,657 |
| Luxembourgers | 84.5 /100 | #149 | Excellent $47,640 |
| Peruvians | 84.2 /100 | #150 | Excellent $47,628 |
| Immigrants | Oceania | 84.1 /100 | #151 | Excellent $47,617 |
Demographics Similar to Immigrants from Northern Europe by Median Earnings
In terms of median earnings, the demographic groups most similar to Immigrants from Northern Europe are Turkish ($53,919, a difference of 0.090%), Asian ($53,690, a difference of 0.34%), Immigrants from France ($53,490, a difference of 0.71%), Soviet Union ($54,290, a difference of 0.78%), and Immigrants from Russia ($53,457, a difference of 0.78%).
| Demographics | Rating | Rank | Median Earnings |
| Immigrants | Belgium | 100.0 /100 | #19 | Exceptional $54,679 |
| Cypriots | 100.0 /100 | #20 | Exceptional $54,589 |
| Burmese | 100.0 /100 | #21 | Exceptional $54,559 |
| Immigrants | Korea | 100.0 /100 | #22 | Exceptional $54,530 |
| Immigrants | Sweden | 100.0 /100 | #23 | Exceptional $54,478 |
| Soviet Union | 100.0 /100 | #24 | Exceptional $54,290 |
| Turks | 100.0 /100 | #25 | Exceptional $53,919 |
| Immigrants | Northern Europe | 100.0 /100 | #26 | Exceptional $53,872 |
| Asians | 100.0 /100 | #27 | Exceptional $53,690 |
| Immigrants | France | 100.0 /100 | #28 | Exceptional $53,490 |
| Immigrants | Russia | 100.0 /100 | #29 | Exceptional $53,457 |
| Cambodians | 100.0 /100 | #30 | Exceptional $53,386 |
| Russians | 100.0 /100 | #31 | Exceptional $53,334 |
| Immigrants | Asia | 100.0 /100 | #32 | Exceptional $53,310 |
| Immigrants | Greece | 100.0 /100 | #33 | Exceptional $53,282 |