Houma vs Welsh Wage/Income Gap
COMPARE
Houma
Welsh
Wage/Income Gap
Wage/Income Gap Comparison
Houma
Welsh
38.7%
WAGE/INCOME GAP
0.0/ 100
METRIC RATING
347th/ 347
METRIC RANK
28.9%
WAGE/INCOME GAP
0.1/ 100
METRIC RATING
321st/ 347
METRIC RANK
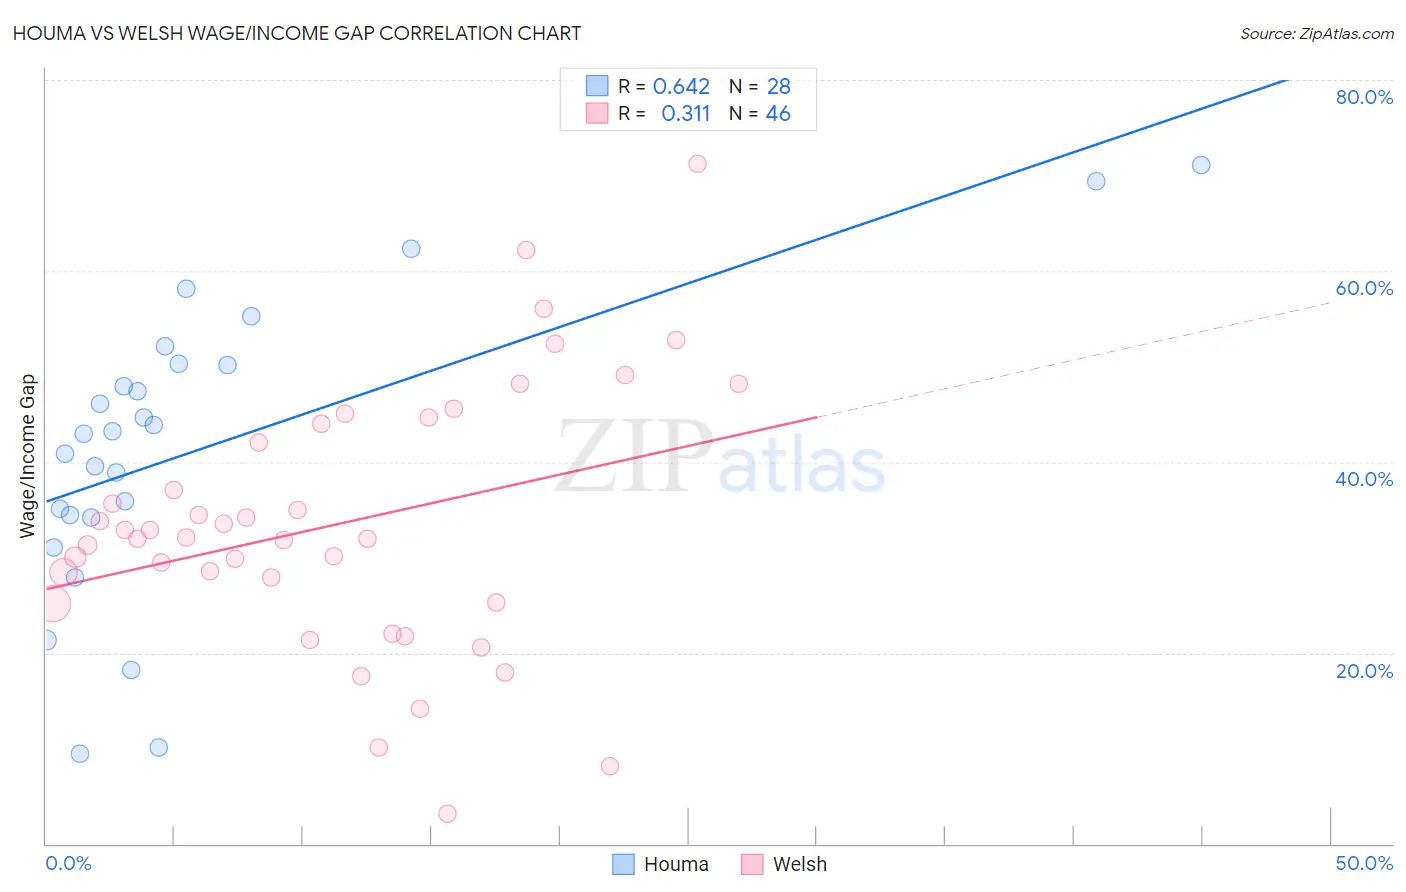
Houma vs Welsh Wage/Income Gap Correlation Chart
The statistical analysis conducted on geographies consisting of 36,791,242 people shows a significant positive correlation between the proportion of Houma and wage/income gap percentage in the United States with a correlation coefficient (R) of 0.642 and weighted average of 38.7%. Similarly, the statistical analysis conducted on geographies consisting of 527,078,541 people shows a mild positive correlation between the proportion of Welsh and wage/income gap percentage in the United States with a correlation coefficient (R) of 0.311 and weighted average of 28.9%, a difference of 33.7%.
Wage/Income Gap Correlation Summary
| Measurement | Houma | Welsh |
| Minimum | 9.5% | 3.1% |
| Maximum | 71.0% | 71.2% |
| Range | 61.6% | 68.1% |
| Mean | 41.5% | 33.5% |
| Median | 43.1% | 32.1% |
| Interquartile 25% (IQ1) | 34.3% | 25.2% |
| Interquartile 75% (IQ3) | 50.2% | 44.0% |
| Interquartile Range (IQR) | 15.9% | 18.8% |
| Standard Deviation (Sample) | 15.4% | 13.8% |
| Standard Deviation (Population) | 15.1% | 13.7% |
Similar Demographics by Wage/Income Gap
Demographics Similar to Houma by Wage/Income Gap
In terms of wage/income gap, the demographic groups most similar to Houma are Cajun (33.9%, a difference of 14.1%), Immigrants from India (31.5%, a difference of 22.6%), Assyrian/Chaldean/Syriac (31.0%, a difference of 24.7%), Danish (31.0%, a difference of 24.9%), and Pennsylvania German (30.7%, a difference of 25.9%).
| Demographics | Rating | Rank | Wage/Income Gap |
| Europeans | 0.0 /100 | #333 | Tragic 29.4% |
| Swedes | 0.0 /100 | #334 | Tragic 29.4% |
| Immigrants | Taiwan | 0.0 /100 | #335 | Tragic 29.5% |
| English | 0.0 /100 | #336 | Tragic 29.5% |
| Dutch | 0.0 /100 | #337 | Tragic 29.6% |
| Filipinos | 0.0 /100 | #338 | Tragic 29.7% |
| Iranians | 0.0 /100 | #339 | Tragic 29.7% |
| Swiss | 0.0 /100 | #340 | Tragic 30.0% |
| Thais | 0.0 /100 | #341 | Tragic 30.5% |
| Pennsylvania Germans | 0.0 /100 | #342 | Tragic 30.7% |
| Danes | 0.0 /100 | #343 | Tragic 31.0% |
| Assyrians/Chaldeans/Syriacs | 0.0 /100 | #344 | Tragic 31.0% |
| Immigrants | India | 0.0 /100 | #345 | Tragic 31.5% |
| Cajuns | 0.0 /100 | #346 | Tragic 33.9% |
| Houma | 0.0 /100 | #347 | Tragic 38.7% |
Demographics Similar to Welsh by Wage/Income Gap
In terms of wage/income gap, the demographic groups most similar to Welsh are Immigrants from Singapore (28.9%, a difference of 0.020%), British (28.9%, a difference of 0.070%), Slovak (28.9%, a difference of 0.13%), Norwegian (29.0%, a difference of 0.13%), and Croatian (29.0%, a difference of 0.25%).
| Demographics | Rating | Rank | Wage/Income Gap |
| Immigrants | Scotland | 0.1 /100 | #314 | Tragic 28.7% |
| Maltese | 0.1 /100 | #315 | Tragic 28.7% |
| Lithuanians | 0.1 /100 | #316 | Tragic 28.7% |
| Belgians | 0.1 /100 | #317 | Tragic 28.8% |
| Basques | 0.1 /100 | #318 | Tragic 28.8% |
| Slovaks | 0.1 /100 | #319 | Tragic 28.9% |
| British | 0.1 /100 | #320 | Tragic 28.9% |
| Welsh | 0.1 /100 | #321 | Tragic 28.9% |
| Immigrants | Singapore | 0.1 /100 | #322 | Tragic 28.9% |
| Norwegians | 0.1 /100 | #323 | Tragic 29.0% |
| Croatians | 0.0 /100 | #324 | Tragic 29.0% |
| Hungarians | 0.0 /100 | #325 | Tragic 29.0% |
| Immigrants | Belgium | 0.0 /100 | #326 | Tragic 29.0% |
| Immigrants | Iran | 0.0 /100 | #327 | Tragic 29.1% |
| Scandinavians | 0.0 /100 | #328 | Tragic 29.1% |