Houma vs Maltese Median Earnings
COMPARE
Houma
Maltese
Median Earnings
Median Earnings Comparison
Houma
Maltese
$38,949
MEDIAN EARNINGS
0.0/ 100
METRIC RATING
333rd/ 347
METRIC RANK
$52,526
MEDIAN EARNINGS
100.0/ 100
METRIC RATING
42nd/ 347
METRIC RANK
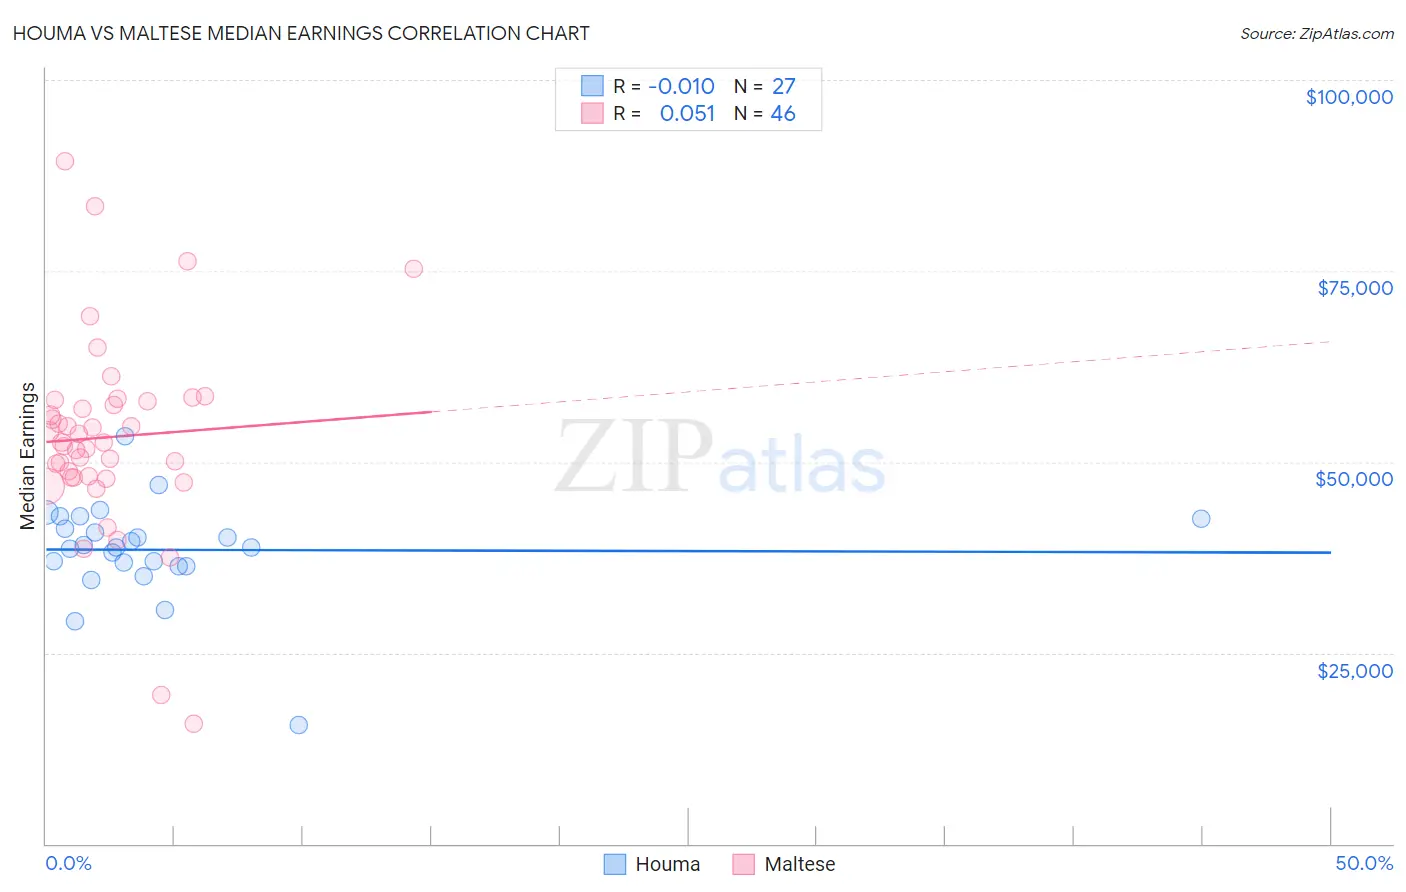
Houma vs Maltese Median Earnings Correlation Chart
The statistical analysis conducted on geographies consisting of 36,796,366 people shows no correlation between the proportion of Houma and median earnings in the United States with a correlation coefficient (R) of -0.010 and weighted average of $38,949. Similarly, the statistical analysis conducted on geographies consisting of 126,475,400 people shows a slight positive correlation between the proportion of Maltese and median earnings in the United States with a correlation coefficient (R) of 0.051 and weighted average of $52,526, a difference of 34.9%.
Median Earnings Correlation Summary
| Measurement | Houma | Maltese |
| Minimum | $15,495 | $15,781 |
| Maximum | $53,358 | $89,336 |
| Range | $37,863 | $73,555 |
| Mean | $38,485 | $53,240 |
| Median | $38,771 | $52,561 |
| Interquartile 25% (IQ1) | $36,392 | $48,020 |
| Interquartile 75% (IQ3) | $42,500 | $57,908 |
| Interquartile Range (IQR) | $6,108 | $9,888 |
| Standard Deviation (Sample) | $6,619 | $12,910 |
| Standard Deviation (Population) | $6,495 | $12,769 |
Similar Demographics by Median Earnings
Demographics Similar to Houma by Median Earnings
In terms of median earnings, the demographic groups most similar to Houma are Spanish American Indian ($38,907, a difference of 0.11%), Native/Alaskan ($38,896, a difference of 0.14%), Yakama ($39,107, a difference of 0.41%), Immigrants from Mexico ($39,114, a difference of 0.42%), and Immigrants from Congo ($39,169, a difference of 0.57%).
| Demographics | Rating | Rank | Median Earnings |
| Immigrants | Yemen | 0.0 /100 | #326 | Tragic $39,540 |
| Yuman | 0.0 /100 | #327 | Tragic $39,523 |
| Sioux | 0.0 /100 | #328 | Tragic $39,448 |
| Kiowa | 0.0 /100 | #329 | Tragic $39,232 |
| Immigrants | Congo | 0.0 /100 | #330 | Tragic $39,169 |
| Immigrants | Mexico | 0.0 /100 | #331 | Tragic $39,114 |
| Yakama | 0.0 /100 | #332 | Tragic $39,107 |
| Houma | 0.0 /100 | #333 | Tragic $38,949 |
| Spanish American Indians | 0.0 /100 | #334 | Tragic $38,907 |
| Natives/Alaskans | 0.0 /100 | #335 | Tragic $38,896 |
| Crow | 0.0 /100 | #336 | Tragic $38,707 |
| Immigrants | Cuba | 0.0 /100 | #337 | Tragic $38,426 |
| Pima | 0.0 /100 | #338 | Tragic $38,285 |
| Menominee | 0.0 /100 | #339 | Tragic $37,884 |
| Navajo | 0.0 /100 | #340 | Tragic $36,999 |
Demographics Similar to Maltese by Median Earnings
In terms of median earnings, the demographic groups most similar to Maltese are Immigrants from Malaysia ($52,514, a difference of 0.020%), Bulgarian ($52,512, a difference of 0.030%), Immigrants from Czechoslovakia ($52,361, a difference of 0.31%), Bhutanese ($52,297, a difference of 0.44%), and Australian ($52,294, a difference of 0.44%).
| Demographics | Rating | Rank | Median Earnings |
| Immigrants | Switzerland | 100.0 /100 | #35 | Exceptional $53,211 |
| Immigrants | Denmark | 100.0 /100 | #36 | Exceptional $53,186 |
| Immigrants | Belarus | 100.0 /100 | #37 | Exceptional $53,043 |
| Latvians | 100.0 /100 | #38 | Exceptional $53,001 |
| Immigrants | Turkey | 100.0 /100 | #39 | Exceptional $52,960 |
| Israelis | 100.0 /100 | #40 | Exceptional $52,937 |
| Immigrants | Lithuania | 100.0 /100 | #41 | Exceptional $52,769 |
| Maltese | 100.0 /100 | #42 | Exceptional $52,526 |
| Immigrants | Malaysia | 100.0 /100 | #43 | Exceptional $52,514 |
| Bulgarians | 100.0 /100 | #44 | Exceptional $52,512 |
| Immigrants | Czechoslovakia | 100.0 /100 | #45 | Exceptional $52,361 |
| Bhutanese | 100.0 /100 | #46 | Exceptional $52,297 |
| Australians | 100.0 /100 | #47 | Exceptional $52,294 |
| Immigrants | Europe | 100.0 /100 | #48 | Exceptional $52,195 |
| Bolivians | 100.0 /100 | #49 | Exceptional $52,005 |