Hmong vs Hispanic or Latino Median Earnings
COMPARE
Hmong
Hispanic or Latino
Median Earnings
Median Earnings Comparison
Hmong
Hispanics or Latinos
$42,111
MEDIAN EARNINGS
0.2/ 100
METRIC RATING
280th/ 347
METRIC RANK
$40,288
MEDIAN EARNINGS
0.0/ 100
METRIC RATING
311th/ 347
METRIC RANK
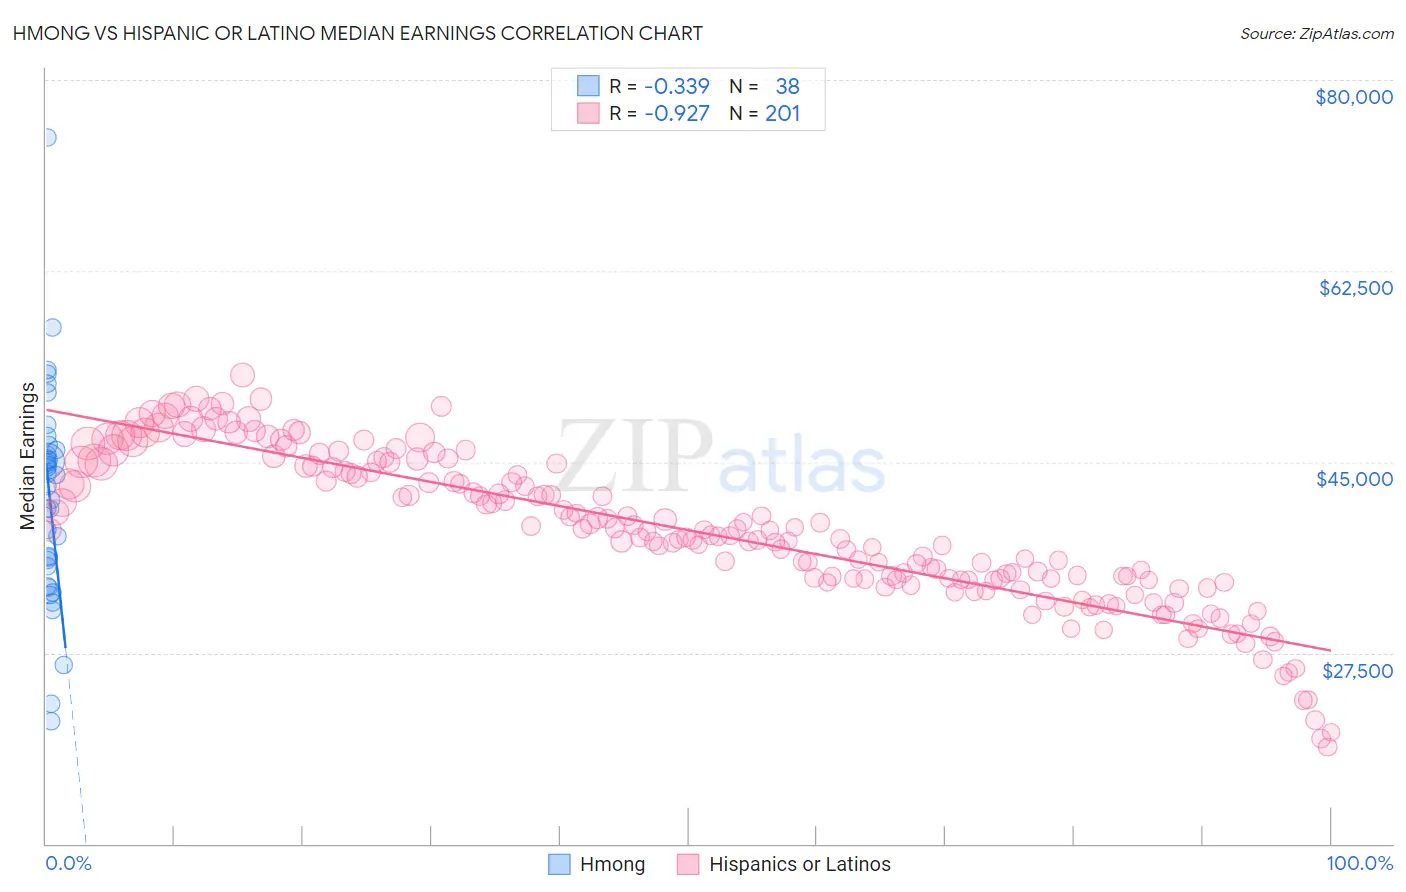
Hmong vs Hispanic or Latino Median Earnings Correlation Chart
The statistical analysis conducted on geographies consisting of 24,671,308 people shows a mild negative correlation between the proportion of Hmong and median earnings in the United States with a correlation coefficient (R) of -0.339 and weighted average of $42,111. Similarly, the statistical analysis conducted on geographies consisting of 578,075,815 people shows a near-perfect negative correlation between the proportion of Hispanics or Latinos and median earnings in the United States with a correlation coefficient (R) of -0.927 and weighted average of $40,288, a difference of 4.5%.
Median Earnings Correlation Summary
| Measurement | Hmong | Hispanic or Latino |
| Minimum | $21,250 | $18,851 |
| Maximum | $74,741 | $52,967 |
| Range | $53,491 | $34,116 |
| Mean | $41,764 | $38,684 |
| Median | $43,269 | $38,266 |
| Interquartile 25% (IQ1) | $35,451 | $34,210 |
| Interquartile 75% (IQ3) | $46,136 | $44,630 |
| Interquartile Range (IQR) | $10,685 | $10,420 |
| Standard Deviation (Sample) | $9,945 | $6,924 |
| Standard Deviation (Population) | $9,814 | $6,907 |
Similar Demographics by Median Earnings
Demographics Similar to Hmong by Median Earnings
In terms of median earnings, the demographic groups most similar to Hmong are Colville ($42,151, a difference of 0.10%), Cajun ($42,189, a difference of 0.19%), Marshallese ($41,969, a difference of 0.34%), African ($41,955, a difference of 0.37%), and Central American ($42,280, a difference of 0.40%).
| Demographics | Rating | Rank | Median Earnings |
| Immigrants | Dominica | 0.4 /100 | #273 | Tragic $42,420 |
| Immigrants | El Salvador | 0.4 /100 | #274 | Tragic $42,413 |
| Immigrants | Belize | 0.3 /100 | #275 | Tragic $42,339 |
| Spanish Americans | 0.3 /100 | #276 | Tragic $42,316 |
| Central Americans | 0.3 /100 | #277 | Tragic $42,280 |
| Cajuns | 0.3 /100 | #278 | Tragic $42,189 |
| Colville | 0.2 /100 | #279 | Tragic $42,151 |
| Hmong | 0.2 /100 | #280 | Tragic $42,111 |
| Marshallese | 0.2 /100 | #281 | Tragic $41,969 |
| Africans | 0.2 /100 | #282 | Tragic $41,955 |
| Dominicans | 0.2 /100 | #283 | Tragic $41,864 |
| Blackfeet | 0.2 /100 | #284 | Tragic $41,822 |
| Immigrants | Nicaragua | 0.1 /100 | #285 | Tragic $41,737 |
| Mexican American Indians | 0.1 /100 | #286 | Tragic $41,719 |
| Indonesians | 0.1 /100 | #287 | Tragic $41,701 |
Demographics Similar to Hispanics or Latinos by Median Earnings
In terms of median earnings, the demographic groups most similar to Hispanics or Latinos are Chippewa ($40,287, a difference of 0.0%), Choctaw ($40,270, a difference of 0.040%), Cheyenne ($40,233, a difference of 0.14%), Seminole ($40,233, a difference of 0.14%), and Immigrants from Honduras ($40,195, a difference of 0.23%).
| Demographics | Rating | Rank | Median Earnings |
| Immigrants | Guatemala | 0.0 /100 | #304 | Tragic $40,851 |
| Chickasaw | 0.0 /100 | #305 | Tragic $40,672 |
| Yaqui | 0.0 /100 | #306 | Tragic $40,647 |
| Hondurans | 0.0 /100 | #307 | Tragic $40,638 |
| Cubans | 0.0 /100 | #308 | Tragic $40,619 |
| Immigrants | Haiti | 0.0 /100 | #309 | Tragic $40,550 |
| Apache | 0.0 /100 | #310 | Tragic $40,388 |
| Hispanics or Latinos | 0.0 /100 | #311 | Tragic $40,288 |
| Chippewa | 0.0 /100 | #312 | Tragic $40,287 |
| Choctaw | 0.0 /100 | #313 | Tragic $40,270 |
| Cheyenne | 0.0 /100 | #314 | Tragic $40,233 |
| Seminole | 0.0 /100 | #315 | Tragic $40,233 |
| Immigrants | Honduras | 0.0 /100 | #316 | Tragic $40,195 |
| Fijians | 0.0 /100 | #317 | Tragic $40,193 |
| Dutch West Indians | 0.0 /100 | #318 | Tragic $40,107 |