Hawaiian vs Immigrants Median Household Income
COMPARE
Hawaiian
Immigrants
Median Household Income
Median Household Income Comparison
Hawaiians
Immigrants
$84,729
MEDIAN HOUSEHOLD INCOME
44.1/ 100
METRIC RATING
181st/ 347
METRIC RANK
$85,818
MEDIAN HOUSEHOLD INCOME
61.3/ 100
METRIC RATING
167th/ 347
METRIC RANK
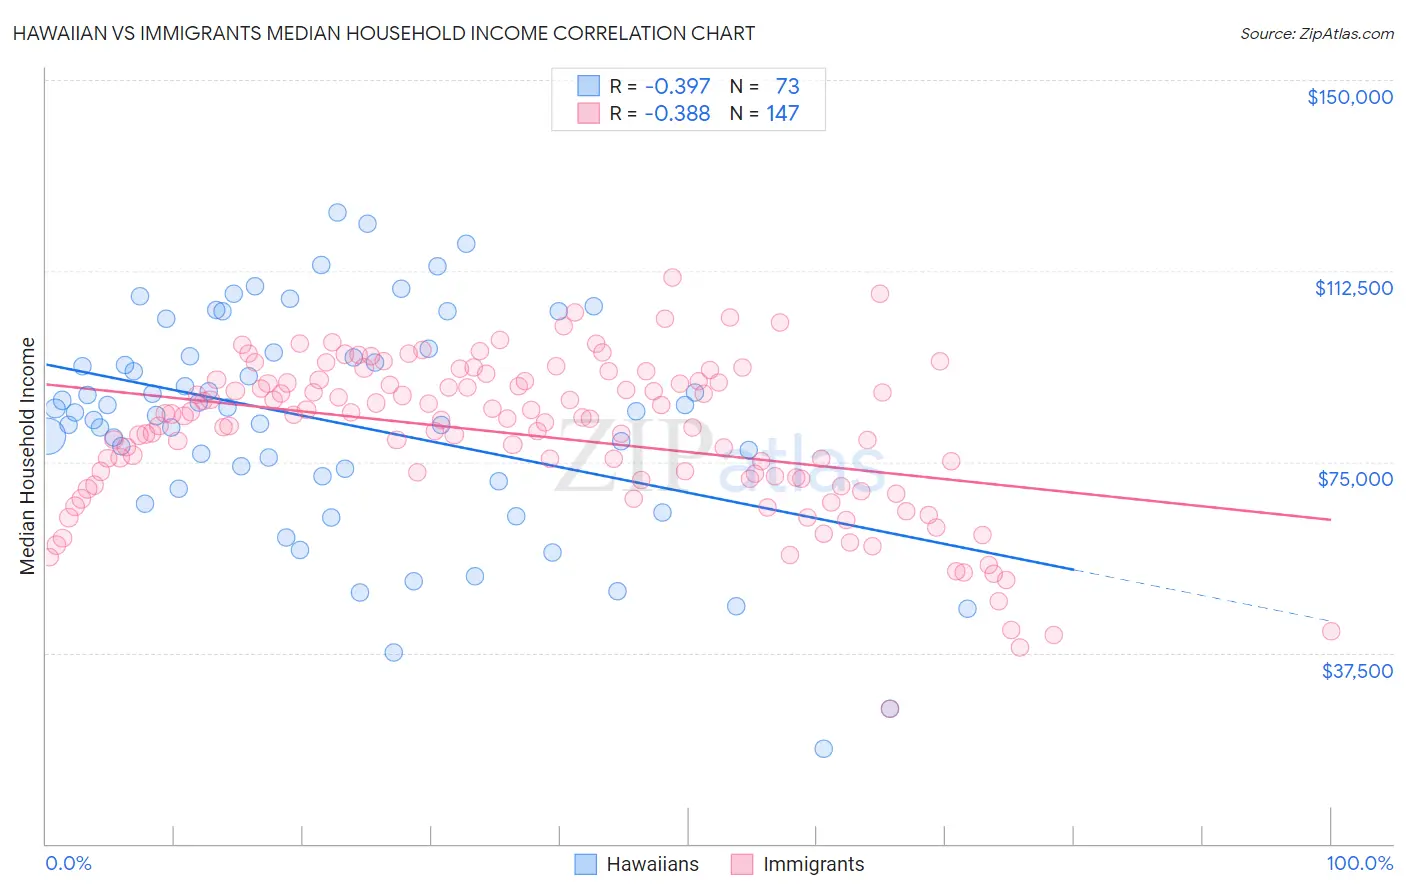
Hawaiian vs Immigrants Median Household Income Correlation Chart
The statistical analysis conducted on geographies consisting of 327,346,569 people shows a mild negative correlation between the proportion of Hawaiians and median household income in the United States with a correlation coefficient (R) of -0.397 and weighted average of $84,729. Similarly, the statistical analysis conducted on geographies consisting of 575,988,831 people shows a mild negative correlation between the proportion of Immigrants and median household income in the United States with a correlation coefficient (R) of -0.388 and weighted average of $85,818, a difference of 1.3%.
Median Household Income Correlation Summary
| Measurement | Hawaiian | Immigrants |
| Minimum | $18,739 | $26,558 |
| Maximum | $123,859 | $111,218 |
| Range | $105,120 | $84,660 |
| Mean | $82,769 | $80,268 |
| Median | $85,043 | $83,546 |
| Interquartile 25% (IQ1) | $71,702 | $71,664 |
| Interquartile 75% (IQ3) | $96,092 | $90,776 |
| Interquartile Range (IQR) | $24,390 | $19,112 |
| Standard Deviation (Sample) | $21,670 | $15,311 |
| Standard Deviation (Population) | $21,522 | $15,259 |
Demographics Similar to Hawaiians and Immigrants by Median Household Income
In terms of median household income, the demographic groups most similar to Hawaiians are Immigrants from Portugal ($84,740, a difference of 0.010%), Uruguayan ($84,691, a difference of 0.040%), Spaniard ($84,644, a difference of 0.10%), English ($84,915, a difference of 0.22%), and Czechoslovakian ($84,965, a difference of 0.28%). Similarly, the demographic groups most similar to Immigrants are Icelander ($85,797, a difference of 0.020%), Colombian ($85,716, a difference of 0.12%), Swiss ($85,681, a difference of 0.16%), Immigrants from South America ($85,611, a difference of 0.24%), and Scandinavian ($86,073, a difference of 0.30%).
| Demographics | Rating | Rank | Median Household Income |
| Irish | 66.2 /100 | #164 | Good $86,145 |
| Norwegians | 65.3 /100 | #165 | Good $86,084 |
| Scandinavians | 65.1 /100 | #166 | Good $86,073 |
| Immigrants | Immigrants | 61.3 /100 | #167 | Good $85,818 |
| Icelanders | 61.0 /100 | #168 | Good $85,797 |
| Colombians | 59.7 /100 | #169 | Average $85,716 |
| Swiss | 59.2 /100 | #170 | Average $85,681 |
| Immigrants | South America | 58.1 /100 | #171 | Average $85,611 |
| Slovenes | 57.4 /100 | #172 | Average $85,562 |
| Immigrants | Cameroon | 53.4 /100 | #173 | Average $85,314 |
| Scottish | 50.0 /100 | #174 | Average $85,101 |
| Immigrants | Costa Rica | 49.2 /100 | #175 | Average $85,054 |
| Alsatians | 49.2 /100 | #176 | Average $85,053 |
| Immigrants | Eritrea | 48.8 /100 | #177 | Average $85,025 |
| Czechoslovakians | 47.8 /100 | #178 | Average $84,965 |
| English | 47.0 /100 | #179 | Average $84,915 |
| Immigrants | Portugal | 44.2 /100 | #180 | Average $84,740 |
| Hawaiians | 44.1 /100 | #181 | Average $84,729 |
| Uruguayans | 43.5 /100 | #182 | Average $84,691 |
| Spaniards | 42.7 /100 | #183 | Average $84,644 |
| Immigrants | Eastern Africa | 37.4 /100 | #184 | Fair $84,299 |